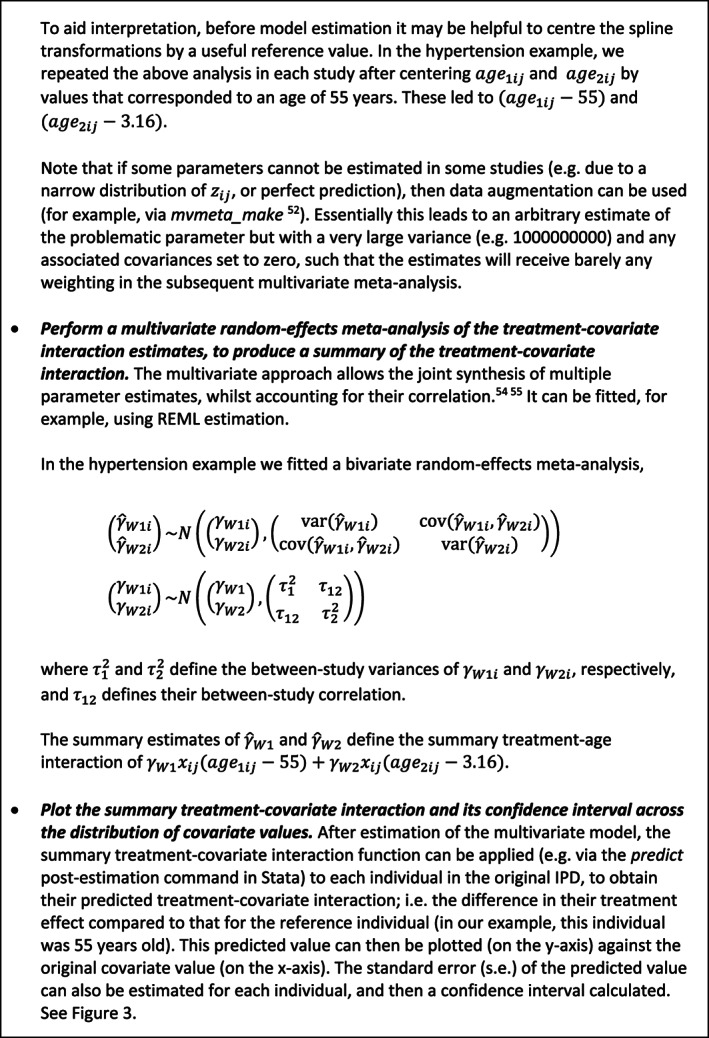
Figure 5.

(B): Overview of the second stage of a two‐stage multivariate IPD meta‐analysis to summarize a nonlinear treatment‐covariate interaction using a restricted cubic spline. The steps are described in relation to the hypertension example of Figure 3 which examined a treatment‐age interaction
