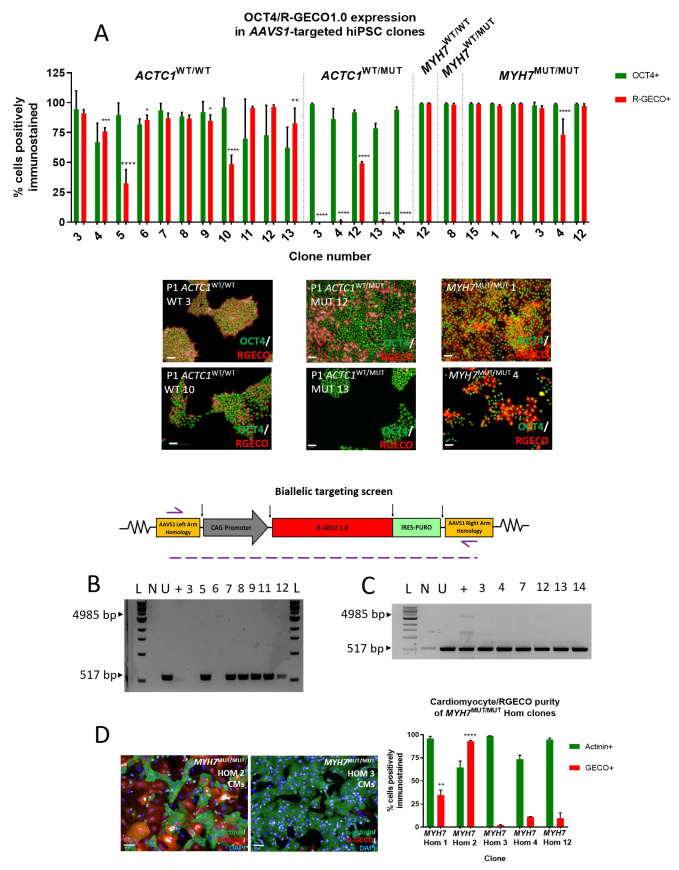
Figure 2. Immunocytochemistry-based screening of AAVS1-targeted clones showing differential expression of R-GECO1.0 between and within cell lines.
( A) AAVS1 targeted hiPSC clones dual-stained for OCT4 (green) and R-GECO (red) to find the highest R-GECO-expressing clone within the five cell line genotypes. High content image analysis identified that ACTC1 WT/WT clone 3 had the highest percentage of pluripotent (94.53% OCT4+) and R-GECO (91.06% ±1.73%) hiPSCs. ACTC1 WT/MUT clone 12 clone had the highest expression of R-GECO (49.37% ±1.33%). Mean ±SD, n = 3 wells. One-way ANOVA with Dunnett’s multiple comparison test, * p ≤ 0.0259; ** p < 0.0045; **** p < 0.0001. Scale bars = 50 µm. ( B) Biallelic targeting PCR screen on isolated gDNA from targeted ACTC1 WT/WT hiPSC clones showing homozygous clones failure to generate the 517bp PCR product. ( C) Biallelic targeting PCR screen showing that all ACTC1 WT/MUT clones tested resulted in a 517bp product and were therefore heterozygous for AAVS1 targeting. L – 1kb ladder; N – no template control; U – untargeted cell line; + - AAVS1 biallelic positive control. ( D) Screening MYH7 MUT/MUT clones using immunocytochemistry on differentiated hiPSC-CMs reveals a significant increase in R-GECO1.0 expression in the MYH7 MUT/MUT Hom 2 clone. Mean ±SD, n = 3 technical replicates. One-way ANOVA with Tukey’s multiple comparison test, ** p ≤ 0.006; **** p < 0.0001. Scale bars = 50 µm.

