Figure 2.
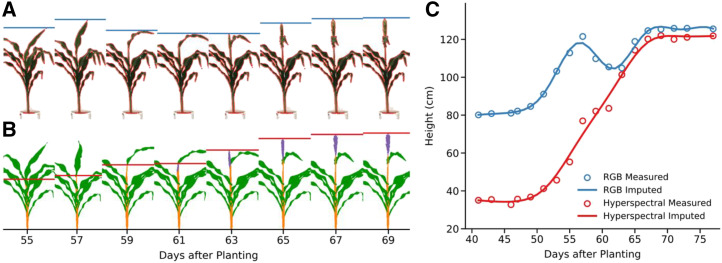
Different methods to define and measure plant height produce different outcomes. A, Conventional RGB images of a single sorghum plant (PI 576401) taken on eight different days spanning the transition from vegetative to reproductive development. Pixels identified as “plant” through whole plant segmentation are outlined in red. Measured plant height, defined as the distance between the plant pixels with the smallest and greatest y axis value, is indicated by the horizontal blue bar in each image. B, Semantically segmented images of same plant taken on the same day from a moderately different viewing angle using a hyperspectral camera. Pixels classified as “leaf” are indicated in green, pixels classified as “stem” are indicated in orange, and pixels classified as “panicle” are indicated in purple. Measured plant height, defined as the distance between stem or panicle pixels with the smallest and greatest y axis value, is indicated by the horizontal red bar in each image. C, Observed and imputed plant heights for the same sorghum plant on each day within the range of phenotypic data collection. Blue and red circles indicate measured height values from whole plant segmentation of RGB images and semantic segmentation of hyperspectral images, respectively. Solid blue and solid red lines indicate height values imputed for unobserved time points using nonparametric regression for whole plant and semantic height datasets, respectively.

