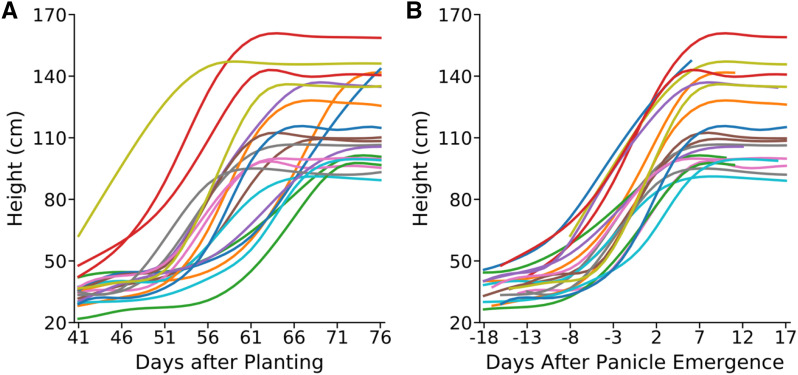
Figure 3.
Comparison of change in plant height over time for members of the SAP population when anchoring either on planting date (DAP) or panicle emergence date (DAPE). A, Growth curves imputed using nonparametric regression for 20 representative sorghum genotypes, anchored for comparison based on sharing the same date of planting. B, Growth curves imputed using nonparametric regression for the same 20 sorghum genotypes shown in A, anchored for comparison based on sharing the same date of panicle emergence. Lines with identical colors in A and B indicate data taken from the same plants. Regression lines are not extended beyond the range of observed data points. As panicle emergence occurred less than 18 d after the start of imaging for some lines and less than 17 d before the last day of imaging for others, curves in B are incomplete.

