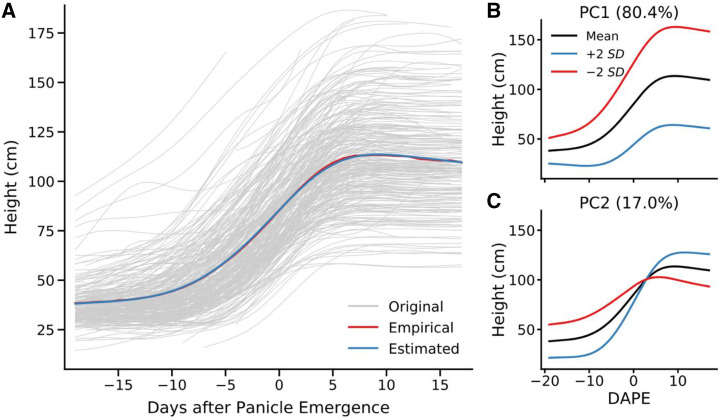
Figure 5.
Two functional principal components explain >97% of variance in the sorghum growth curves observed in this study. Functional principal component analysis seeks to describe the pattern of change in height over time of each observed plant using a mean function combined with variable weightings of a set of eigenfunctions. A, Comparison of the empirical mean function (red) for all growth curves observed in this study (gray) and the mean function estimated using functional principal component analysis (blue). B, Illustration of how changing the score for functional principal component one alters the resulting growth curve. C, Illustration of how changing the score for functional principal component two alters the resulting growth curve.

