Figure 6.
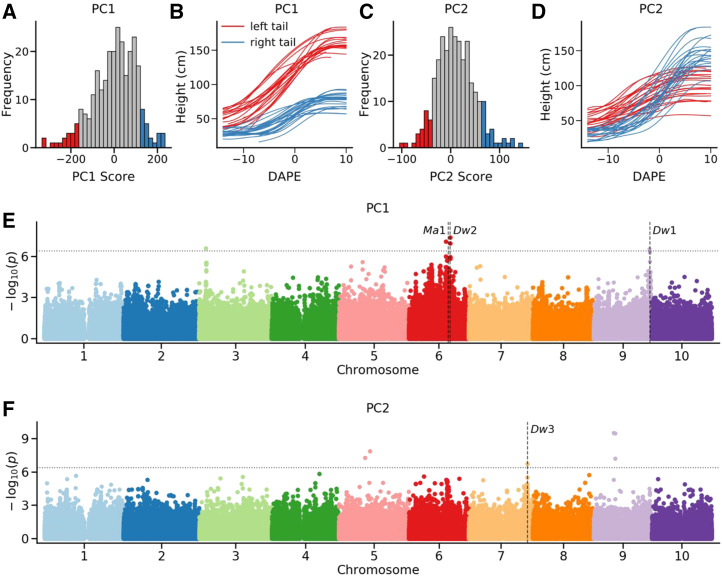
Mapping genes associated with variation in functional principal component scores among sorghum genotypes. A, Distribution of functional principal component one scores among the 292 genotypes phenotyped as part of this study. Genotypes with the most negative values for functional principal component one are indicated in red, and genotypes with the most positive values for functional principal component one are indicated in blue. B, Growth curves for a subset of genotypes with the most negative values for functional principal component one are indicated in red. Growth curves for a subset of genotypes with the most positive values for functional principal component one are indicated in blue. C, Distribution of functional principal component two scores among the 292 genotypes phenotyped as part of this study. Genotypes with the most negative values for functional principal component two are indicated in red, and genotypes with the most positive values for functional principal component two are indicated in blue. D, Growth curves for a subset of genotypes with the most negative values for functional principal component two are indicated in red. Growth curves for a subset of genotypes with the most positive values for functional principal component two are indicated in blue. E, Results of conducting a genome-wide association analysis for functional principal component one scores. F, Results of conducting a genome wide association analysis for functional principal component two scores. In E and F, the positions of three cloned dwarf genes Dw1, Dw2, and Dw3 as well as the cloned maturity gene Ma1 are indicated using vertical dash lines. Horizontal dash lines indicate multiple testing corrected cutoff of a statistically significant association.

