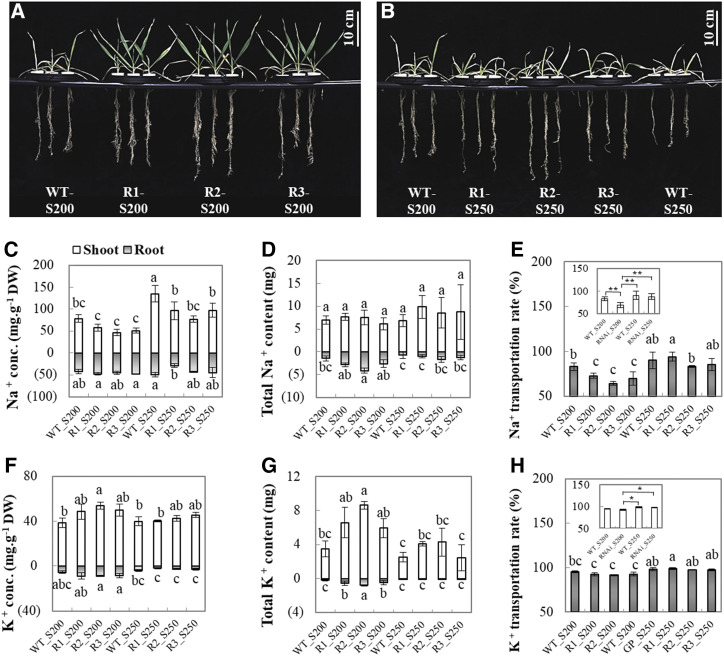
Figure 4.
Na and K element analysis of wild-type (WT) and RNAi plants under salt conditions. A and B, Wild-type and RNAi seedlings exposed to 200 mm (S200) and 250 mm (S250) salt solutions for 4 weeks. C to H, Na+ concentration (C), Na+ content per plant (D), Na+ transportation rate (E), K+ concentration (F), K+ content per plant (G), and K+ transportation rate (H) of wild-type and RNAi plants under salt stress. RNAi lines, R1, R2, and R3. Data are means of four replicates ± se (n = 4). Different lowercase letters above the columns represent significant differences at P < 0.05 determined by one-way ANOVA. Asterisks in the insets of E and H represent significant and highly significant differences as determined by independent Student’s t test (*P < 0.05 and **P < 0.01). DW, Dry weight.

