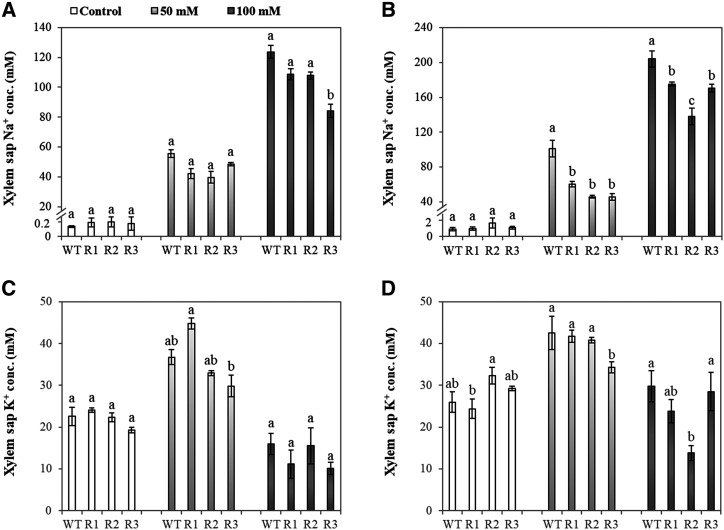
Figure 6.
Na+ and K+ concentrations in xylem sap of wild-type (WT) and RNAi plants under control and salt conditions. Na+ (A and B) and K+ (C and D) concentrations of xylem sap are shown in 4-week-old wild-type and RNAi seedlings exposed to control, 50 mm, and 100 mm NaCl solutions for 2 d (A and C) and 7 d (B and D). Data are means ± se (n = 4–6). RNAi lines, R1, R2, and R3. Different lowercase letters represent significant differences at P < 0.05 as determined by one-way ANOVA.

