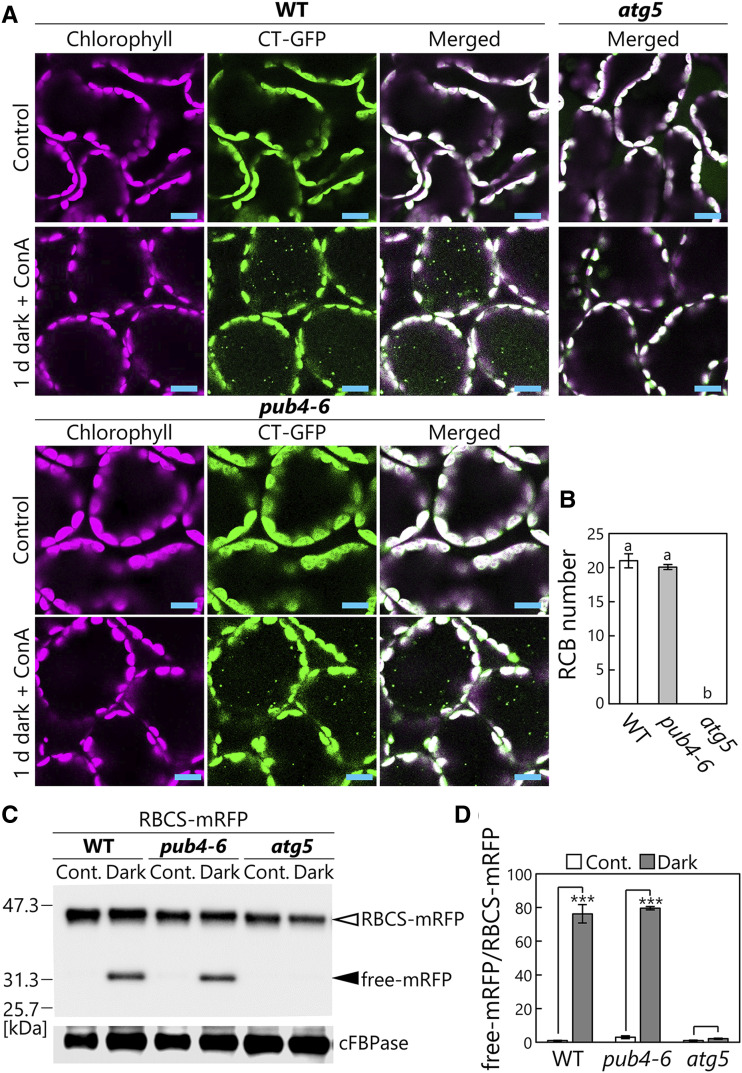
Figure 3.
Comparable activity of piecemeal-type chloroplast autophagy between wild-type (WT) and pub4-6 leaves. A, Confocal images of wild-type, pub4-6, and atg5 mesophyll cells expressing CT-GFP from either nontreated control leaves or leaves incubated in darkness for 1 d with concanamycin A (ConA) added. Chlorophyll (magenta) and CT-GFP (green) signals are shown. In the merged images, overlapping regions of chlorophyll and GFP appear white. Only merged images are shown for atg5 plants. Small GFP dots represent RCBs in the vacuole. Bars = 10 µm. B, Number of RCBs in a fixed area after 1 d of incubation in darkness with concanamycin A. Error bars indicate se (n = 3). Different letters denote significant differences based on Tukey’s test (P < 0.05). C, RFP and cFBPase (loading control) detected by immunoblotting of soluble protein extracts from wild-type, pub4-6, and atg5 leaves expressing RBCS-mRFP. Proteins extracted from either nontreated control leaves (Cont.) or leaves after 2 d of incubation in darkness were used. The open arrowhead indicates RBCS-mRFP fusion, and the closed arrowhead indicates free mRFP derived from autophagic degradation of RBCS-mRFP. The confocal images for leaves in the same treatment groups are shown in Supplemental Figure S3. D, Quantification of free mRFP/RBCS-mRFP ratio shown relative to that of nontreated wild-type leaves, which was set to 1. Error bars indicate se (n = 3). Asterisks denote significant differences due to the dark treatment based on Student’s t test (***P < 0.001).

