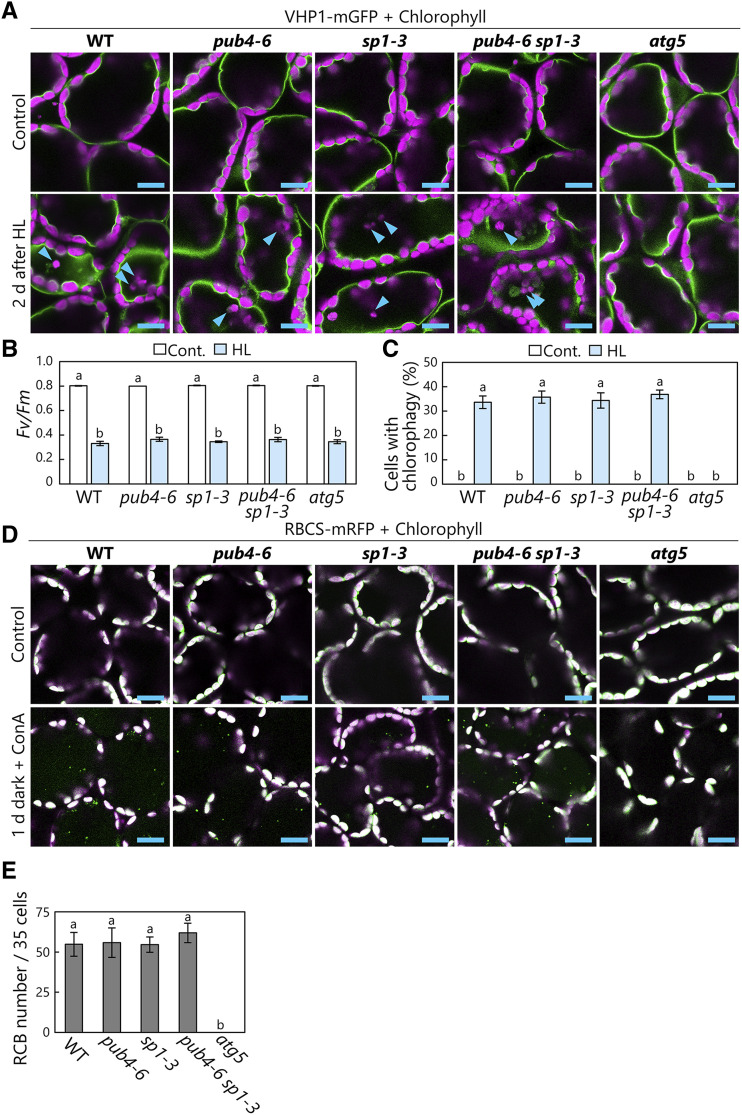
Figure 4.
SP1 is dispensable for the induction of chloroplast autophagy. A, Confocal images of wild-type (WT), pub4-6, sp1-3, pub4-6 sp1-3, and atg5 mesophyll cells expressing the tonoplast marker VHP1-mGFP from either nontreated control leaves or leaves 2 d after HL (2,000 µmol m-2s−1) treatment for 2 h at 10°C. Arrowheads indicate vacuole-enclosed chloroplasts. Chlorophyll (magenta) and VHP1-mGFP (green) signals are shown. Only merged images are shown. B, Fv/Fm ratios measured before (Cont.) and immediately after HL treatment. Error bars indicate se (n = 6). C, Proportions of cells with vacuole-enclosed chloroplasts in a fixed region, measured 2 d after HL treatment. Error bars indicate se (n = 4). D, Confocal images of wild-type, pub4-6, sp1-3, pub4-6 sp1-3, and atg5 mesophyll cells expressing stromal RBCS-mRFP from either nontreated control leaves or leaves incubated in darkness for 1 d with concanamycin A (ConA) added. Chlorophyll (magenta) and RBCS-mRFP (green) signals are shown. In the merged images, overlapping regions of chlorophyll and RFP appear white. Only merged images are shown. Small RFP dots represent RCBs in the vacuole. E, Number of RCBs in a fixed number of cells (35) after 1 d of incubation in darkness with concanamycin A. Error bars indicate se (n = 6). In B, C, and E, different letters denote significant differences based on Tukey’s test (P < 0.05). Bars = 10 µm (A and D).

