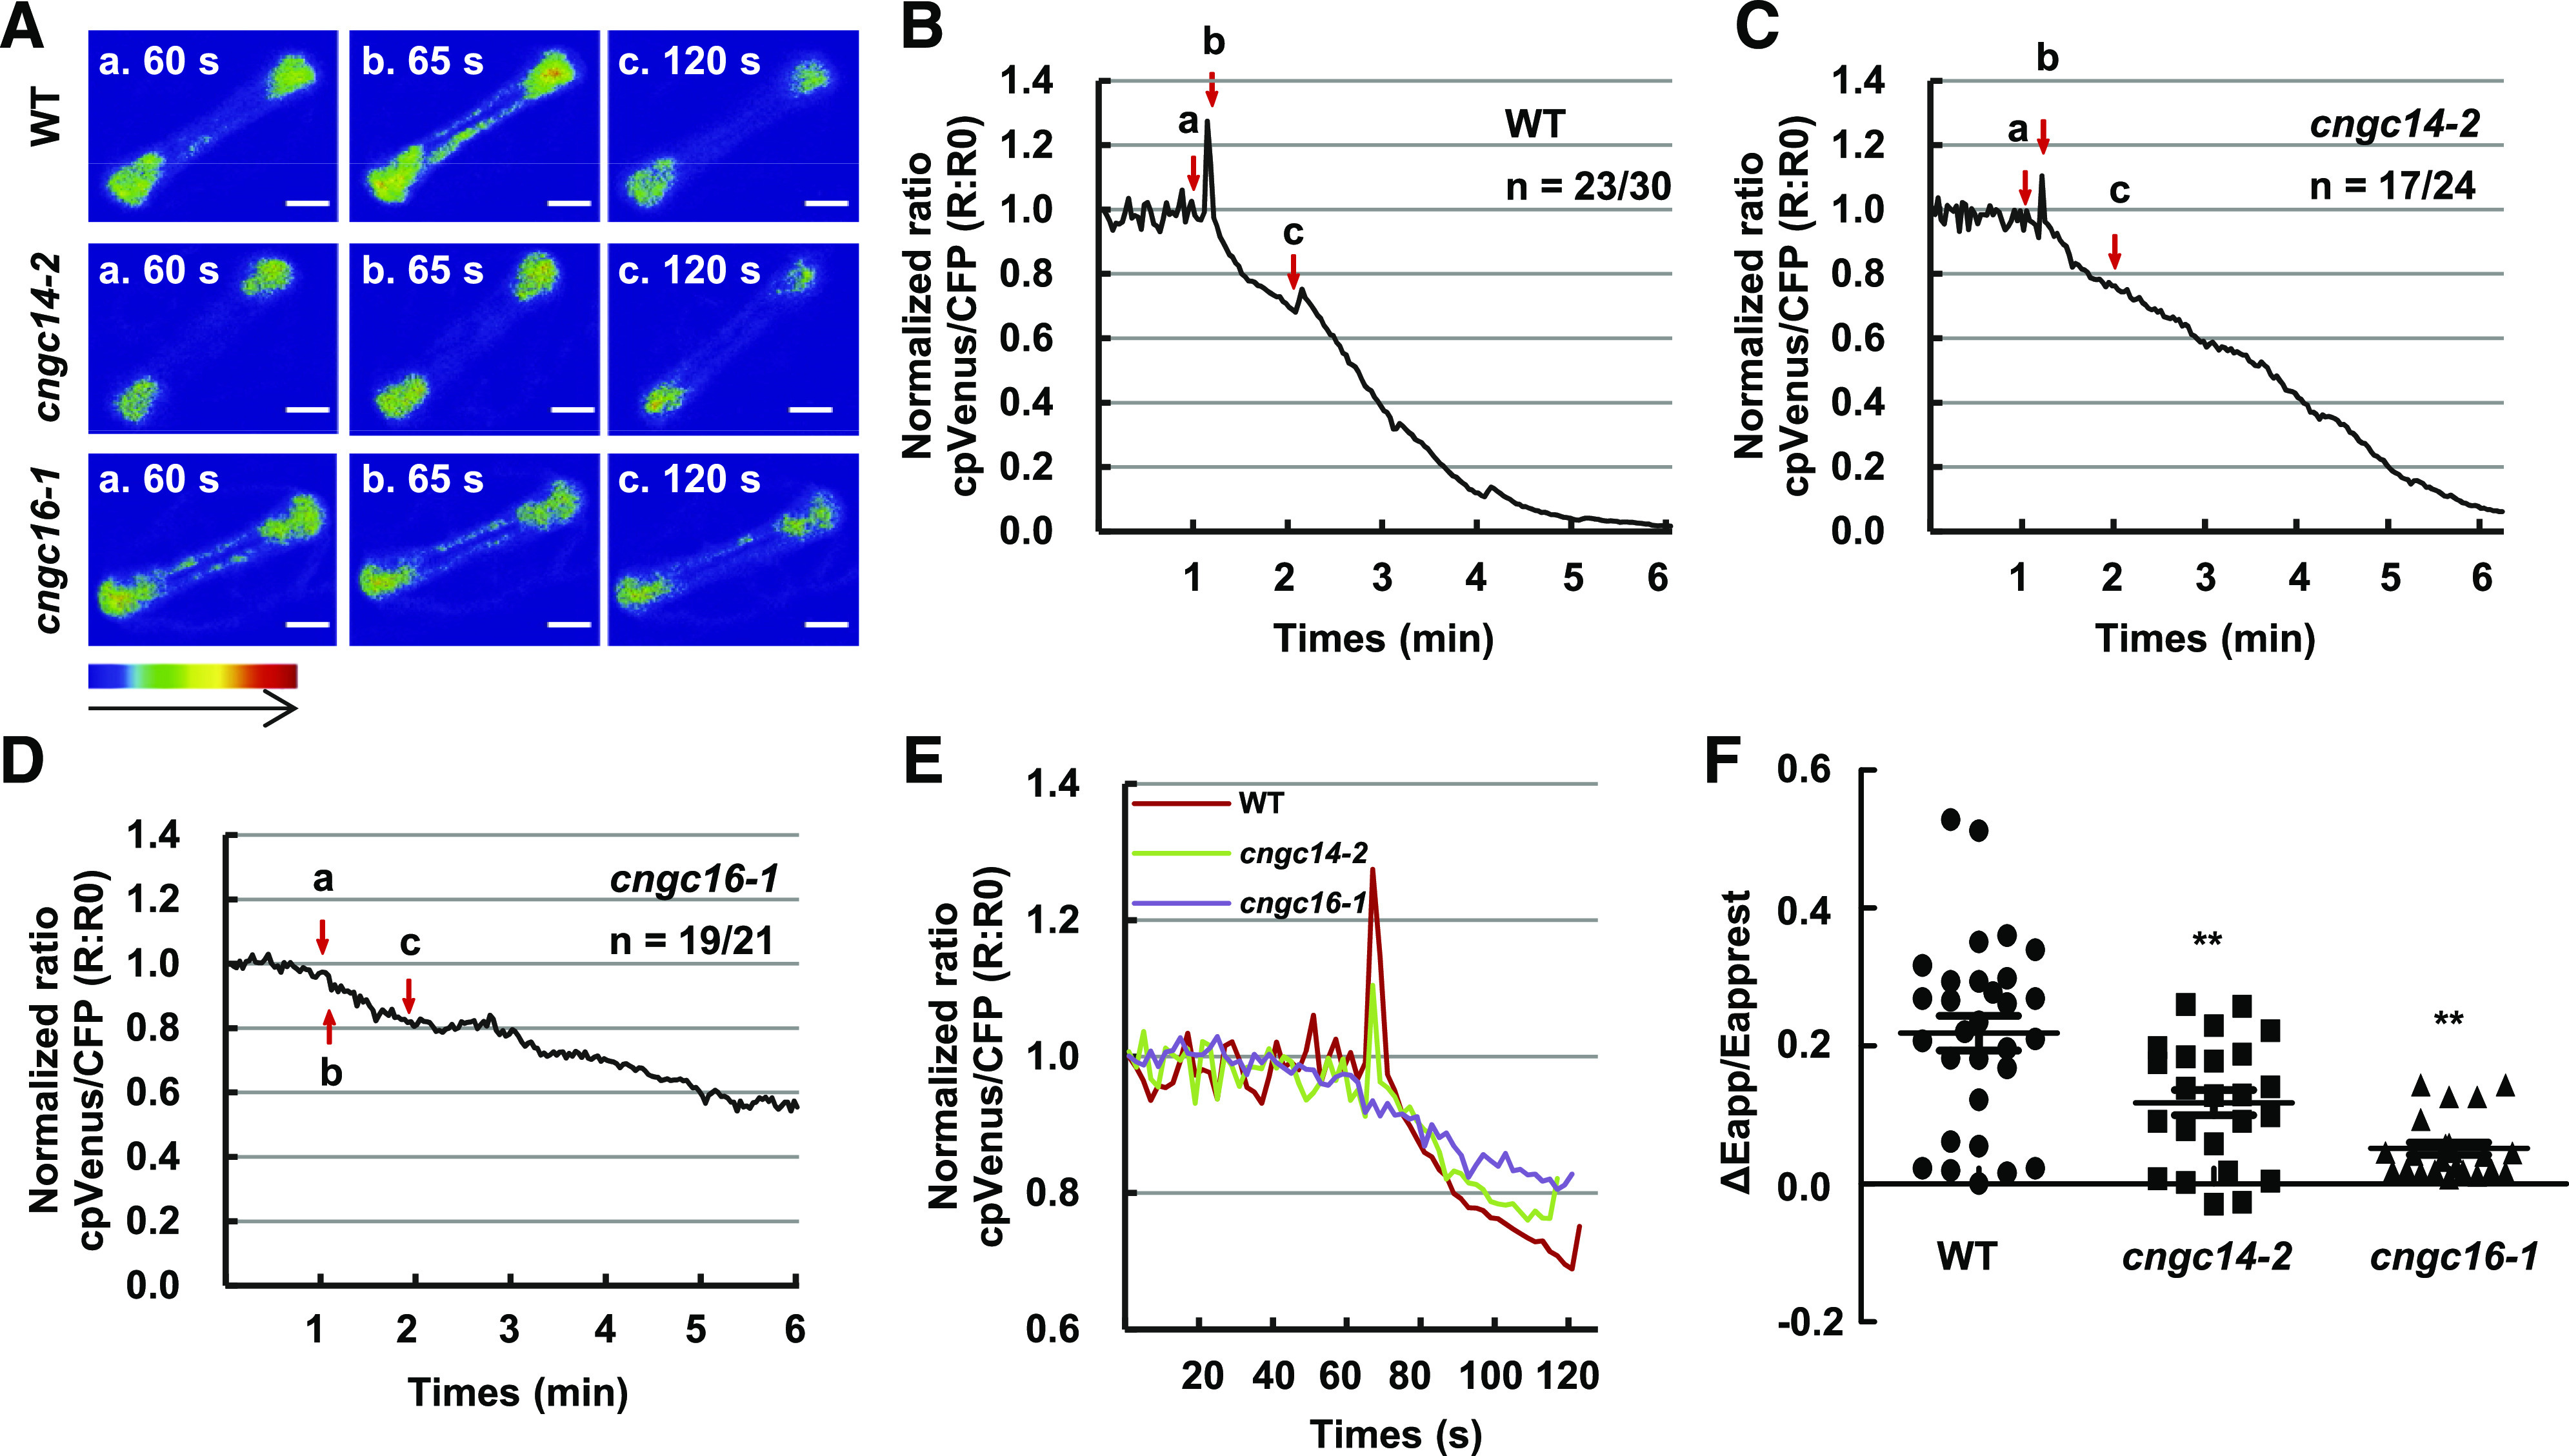
Figure 6.

Cold-induced cytosolic Ca2+ changes in guard cells of cngc14 and cngc16 mutants. A, Emission images of cytosolic Ca2+ in the stomatal cells from leaves of wild-type (WT), cngc14-2, and cngc16-1 10-d-old seedlings expressing NES-YC3.6. Shown are representative images before chilling treatment (60 s) and after chilling treatment (65 and 120 s). The representative image of relative cytosolic Ca2+ is represented as the emission fluorescence ratio and scaled by a pseudo-color bar (bottom). Scale bars = 50 μm. B to D, Normalized cytosolic Ca2+ FRET ratio in stomatal cells. The luminescence was recorded at 2-s intervals. Shown is the representative image of calcium signals in stomatal cells of the wild type, cngc14-2, and cngc16-1. Lowercase letters refer to the time points at which these ratio images were taken in A. At least 21 stomatal cells (one leaf/plant, 1–2 stomatal cells/leaf) in the third leaves from at least 10 different seedlings were measured. The two numbers underneath each genotype indicate the number of cells with the representative calcium pattern versus the number of cells analyzed. E, Representative traces of calcium signals from the wild type and the mutants are shown together. F, Scatter plots of the cold-induced changes in cytosolic calcium (Δcytosolic Ca2+) in wild type, cngc14-2, and cngc16-1 as shown in B to D. The Δcytosolic Ca2+ indicates the changes between the [Ca2+]peak and [Ca2+]rest. Data are from all cells that were monitored (30, 24, and 21 cells for the three genotypes respectively). Asterisks indicate significant difference by Student’s t test (**P < 0.01).
