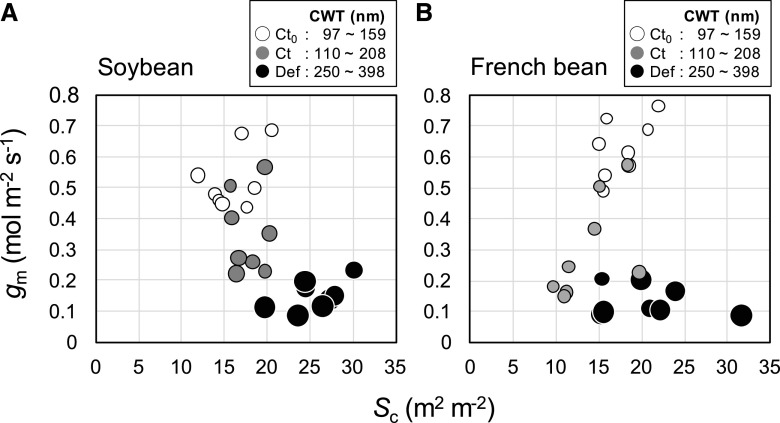
Figure 5.
Relationships between gm and Sc in the primary leaves of soybean (A) and French bean (B), grown under HN and LN conditions. Values were obtained at 0 and 2 WAD. Open circle, gray circle, and closed circle represent Ct0, Ct, and Def plants at 2 WAD, respectively. Circle size represents the CWT.

