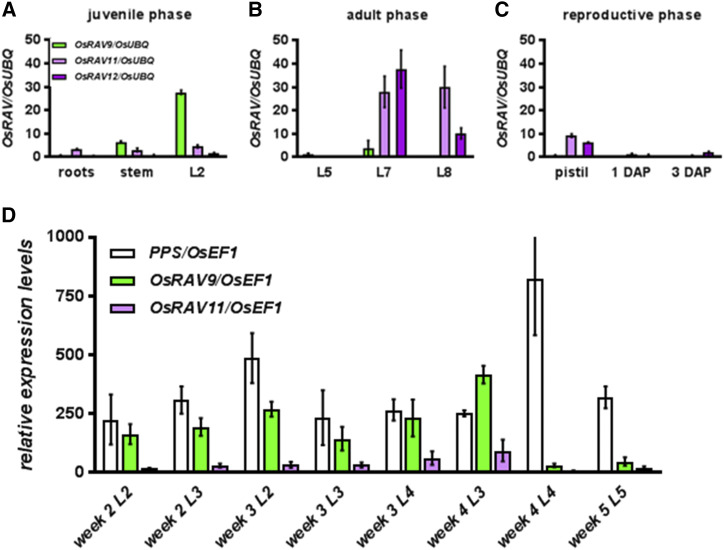
Figure 2.
Patterns of OsRAV genes expression during plant development. A to C, Transcript levels of OsRAVs, relative to OsUBQ, in vegetative and reproductive tissues of wild-type plants. A, RT-qPCR in roots, stems, and L2 dissected from 1-week-old seedlings. B, RT-qPCR in mature leaves (L5, L6, L7) dissected from 10-week-old adult plants. C, RT-qPCR in mature pistils and fertilized ovaries 1 and 3 d after pollination (DAP). D, Transcript abundance of PPS (white), OsRAV9 and OsRAV11, relative to OsUBQ, in juvenile (L2) and adult (L3-L4-L5) leaves. At week 2, L3 is formed and L4 is emerging. At week 3, L4 expands and L5 is emerging. At week 4, L5 is fully expanded. Expression data are mean values of three biological replicates, and error bars represent sd.

