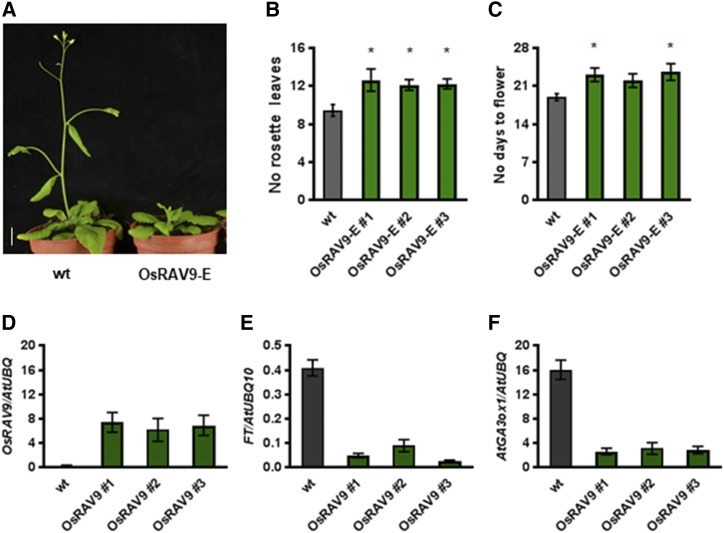
Figure 3.
Late flowering phenotype of Arabidopsis plants expressing OsRAV9. A, Representative images of wild-type (wt; left) and OsRAV9-E transgenic (right) plants grown for 4 weeks under LD. Scale bar = 1 cm. B and C, Flowering time scored as number of rosette leaves and number of days to flower of wild-type (gray) and OsRAV9-E lines (green) grown under LD. D to F, Relative expression levels of OsRAV9 and TEM1 downstream targets in wild-type and representative T3 OsRAV9-E lines grown for 1 week under LD. D, Ectopic expression of OsRAV9 in transgenic Arabidopsis lines. E and F, Down-regulation of FT and AtGA3ox1 in OsRAV9-E lines compared with wild-type. Flowering time data are the average of 25 plants each genotype, with sem. Three biological replicates gave similar results, and one was chosen as representative. Data were analyzed by one-way ANOVA followed by Dunnett's multiple comparisons test between wild-type and transgenic lines. Asterisks indicate statistical significance (*P < 0,05). Expression data are reported as mean values of three biological replicates; error bar represents the sem. AtUBQ10 was used for normalization.

