Figure 4.
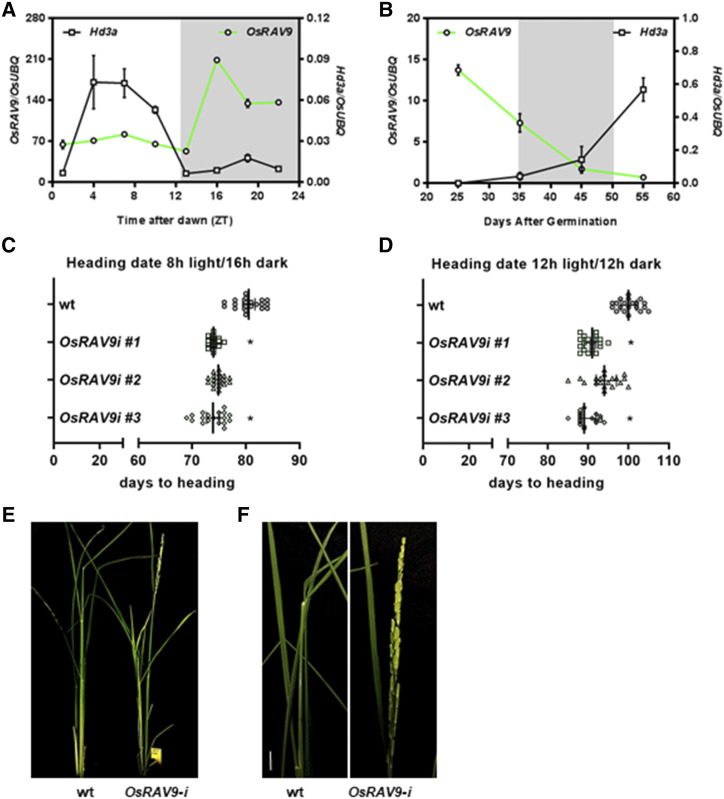
Role of OsRAV9 in heading date. A, Diurnal oscillation of Hd3a and OsRAV9 expression in leaves of 4-week-old wild-type (wt) plants. Gray block indicates night. B, Mutually exclusive expression patterns of Hd3a and OsRAV9 in leaves throughout wild-type (wt) plant development. Gray block indicates floral transition. C and D, Scatter plots representing heading date as number of days to flower of wild-type (in gray) and OsRAV9-i plants (in light green) grown under inductive photoperiods (8-h light/16-h dark, 12-h light/12-h dark). Lines represent the median with 95% of confidence interval. E, Early flowering phenotype of a selected OsRAV9 silencing line (RAV9-i 3, right) compared with wild-type (left) 100 d after germination (DAG). F, Close-up view showing wild-type panicle at the booting stage and OsRAV9-i panicle at anthesis. For molecular analyses, plants were grown under 12-h light/12-h dark at 28°C, whereas for heading date plants were grown under different daylengths. Bars = 10 cm. Expression data are reported as mean values of three biological replicates; error bar represents the sem. Flowering time data are the average of 18 to 20 plants each genotype. Three biological replicates gave similar results, and one was chosen as representative. Data were analyzed by one-way ANOVA followed by Dunnett's multiple comparisons test between wild-type and transgenic lines. Asterisks indicate statistical significance ( *P < 0.05 and**P < 0.033).

