Figure 6.
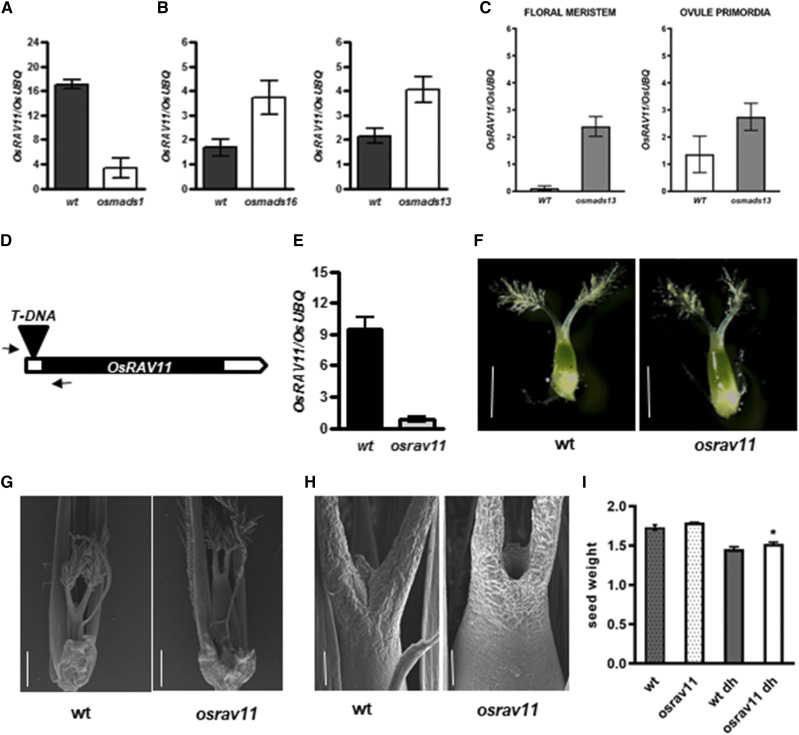
Molecular and functional characterization of OsRAV11. A to C, Misregulation of OsRAV11 in floral homeotic mutants. A, Down-regulation of OsRAV11 in osmads1 developing inflorescences. B, Up-regulation of OsRAV11 in osmads16 and osmads13 developing inflorescences. C, Strong activation of OsRAV11 in specific cell types (floral meristem and ovule primordia) isolated from osmads13 mutant flowers. D, Schematic representation of the T-DNA insertion in the 5′ untranslated region of OsRAV11. Arrows indicate primers used for genotyping. E, Down-regulation of OsRAV11 in pistils dissected from osrav11 mutant flowers at maturity. F to H, Morphological analyses of female reproductive structures at maturity. F, Representative images of wild-type and osrav11 carpels dissected from mature flowers at anthesis obtained by optical microscopy. G and H, Representative images of reproductive structures obtained by scanning electron microscopy (sem). G, Wild-type and osrav11 carpels upon fertilization. Glumes were partly removed to show female reproductive organs. H, Apical tissues of wild-type and osrav11 gynoecia after pollination. Bars = 1 mm (F), 500 μm (G), and 100 μm (H). I, Bar plots representing the weight of seed produced by wild-type (in gray) and osrav11 (in white) plants grown in the greenhouse under inductive conditions. Expression data are reported as mean value of three biological replicates; error bar represents the sem. Phenotypic data are the average of three biological replicates of the weight of 100 seeds each genotype, with sem. Statistical significance was examined by Student’s two-tailed unpaired t test (*P < 0.05).

