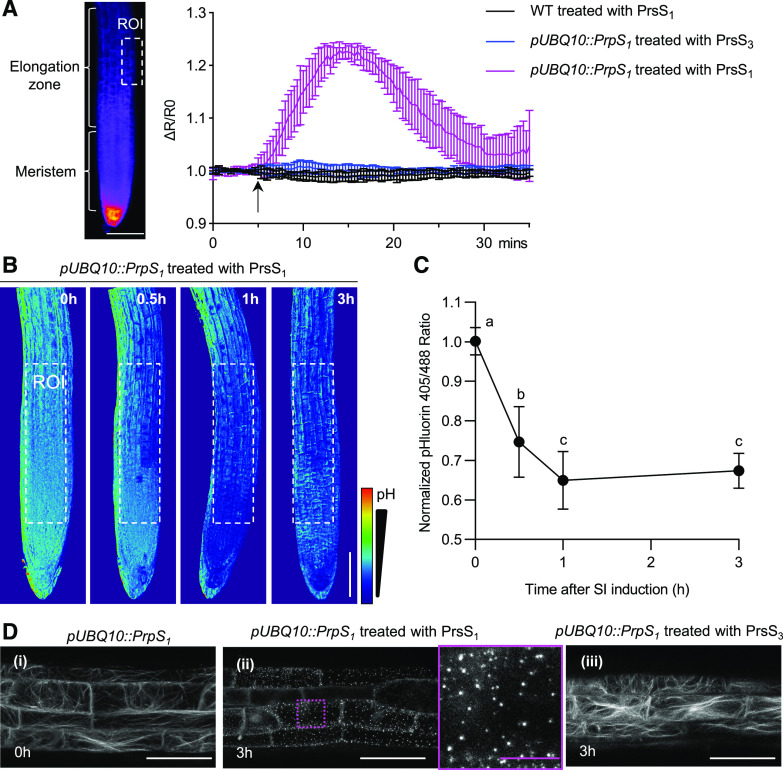
Figure 3.
Key hallmarks of the P. rhoeas SI response are observed in the Arabidopsis PrpS-expressing roots after PrsS treatment. A, PrsS induces transient increases in [Ca2+]cyt in cognate PrpS-expressing Arabidopsis seedling roots. The quantitation of changes in [Ca2+]cyt was measured in Arabidopsis seedling roots in the elongation zone (region of interest [ROI]; left image, dotted box) using the Ca2+ marker YC3.6 signal expressed as fractional ratio changes (ΔR/R0; mean ± sd; n = 6). After PrsS addition (10 ng µL−1; indicated by the arrow), an increase in [Ca2+]cyt was observed in the elongation zone of pUBQ10::PrpS1 roots treated with PrsS1 (magenta); controls (black and blue) did not display this response. WT, Wild type. B and C, PrsS triggers acidification in cognate PrpS-expressing Arabidopsis seedling root. B, Ratiometric (405:488 nm) imaging of pUBQ10::PrpS1 roots expressing the pH sensor pHluorin after PrsS1 (10 ng µL−1) addition revealed that the signal ratio decreased, indicating cytosolic acidification. Bar = 100 µm. C, Quantification of the pHluorin ratio measured in the region of interest (white dotted boxes in B) of these roots shows a significant decrease in [pH]cyt after SI induction (means ± sd; n = 12; one-way ANOVA with multiple comparison test, between A and B and between B and C, P < 0.001; C versus C is not significant). The pHluorin ratio at time 0 h was normalized to 1. D, PrsS treatment triggers S-specific loss of actin filaments and the formation of actin foci in roots. Representative images (n > 6) of confocal imaging of pUBQ10::PrpS1 roots (elongation zone) expressing LifeAct-mRuby2 are shown. i, Prior to treatment, typical longitudinal actin filament bundles were observed. ii, At 3 h after treatment with PrsS1 (10 ng µL−1), actin foci were observed (magenta dotted box and magnification of this region to the right). iii, The same line at 3 h after the addition of PrsS3 proteins (10 ng µL−1) displayed normal longitudinal actin filament bundles. Images are full projections. White bars = 50 µm, and magenta bar = 10 µm.

