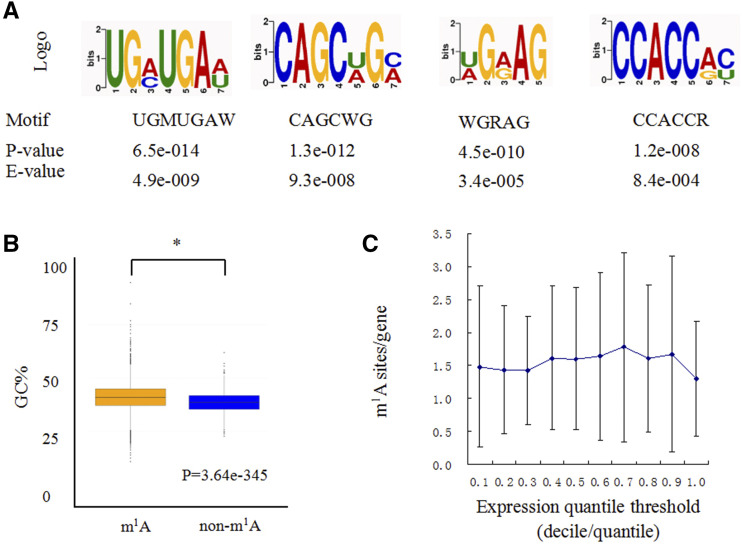
Figure 4.
Sequence and structure traits of m1A peaks. A, Three representative sequence motifs enriched with m1A. B, GC content comparisons between m1A peaks and control sequences. GC% is the percentage of G + C content within the m1A peaks. Statistical analysis was performed using one-way ANOVA followed by Duncan’s NMRT. Asterisks indicate significant differences at the P = 0.05 level. The data points (whiskers) represents the GC content ratio of the modified m1A sequence and the corresponding nonmodified m1A sequence. The blocks are drawn based on these data and are the characteristics of the box graph. The bars are the main shaft of the box. C, Transcripts with different expression levels are divided into 10 groups, and the m1A density of each group is calculated separately. The error bars represent the se of m1A sites/gene of two biological repeats.

