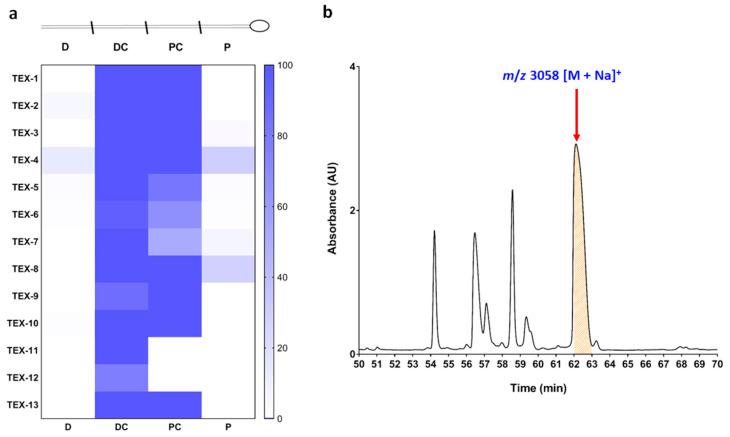
Figure 1.
(a) TxVIA distribution across the four venom duct sections (distal (D), distal central (DC), proximal central (PC), proximal (P)) of 13 Conus textile specimens. (b) Partial chromatogram of TEX-4 DC section fractionation. The x-axis represents the retention time, the y-axis represents UV absorption at 214 nm, and the red arrow indicates TxVIA eluting at 62.5 min (mass data obtained by MALDI-TOF MS).

