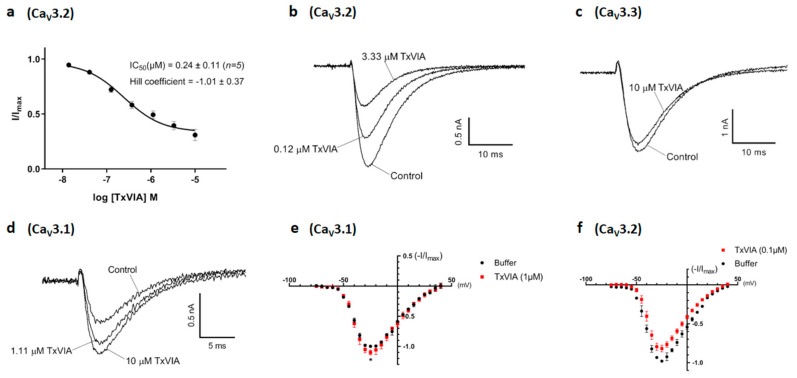
Figure 3.
Modulation of CaV3.1, CaV3.2 and CaV3.3 current by TxVIA. (a) Concentration response curves of TxVIA on recombinant hCaV3.2 channels (n = 5) using the QPatch. Data are means ± SEM. (b) Representative CaV3.2 ICa during 200 ms depolarisations to Vmax (−20 mV) from a holding potential of −90 mV before and after perfusions of 0.12 µM and 3.33 µM of TxVIA, as indicated. (c) Representative CaV3.3 ICa during 200 ms depolarisations to Vmax (−10 mV) from a holding potential of −90 mV before and after perfusions of 10 µM of TxVIA, as indicated. (d) Representative CaV3.1 ICa during 200 ms depolarisations to Vmax (−20 mV) from a holding potential of −90 mV before and after perfusions of 1.11 µM and 10 µM of TxVIA, as indicated. (e) Normalised I–V relationships of CaV3.1 (n = 5) plotted from –75 mV to +40 mV before (black) and after (red) the addition of 1 µM of TxVIA, Vmax at −25 mV (10.0% ± 3.9% current enhancement, p = 0.04), Imax at 0.12 ± 0.01 nA. Data are means ± SEM. Single-voltage protocol was applied in between to measure the TxVIA effect. (f) Normalised I–V relationships of CaV3.2 (n = 4) plotted from −75 mV to +40 mV before (black) and after (red) the addition of 0.1 µM of TxVIA, Vmax at −25 mV, Imax at 0.65 ± 0.04 nA. Data are means ± SEM. Single-voltage protocol was applied in between to measure the TxVIA effect.

