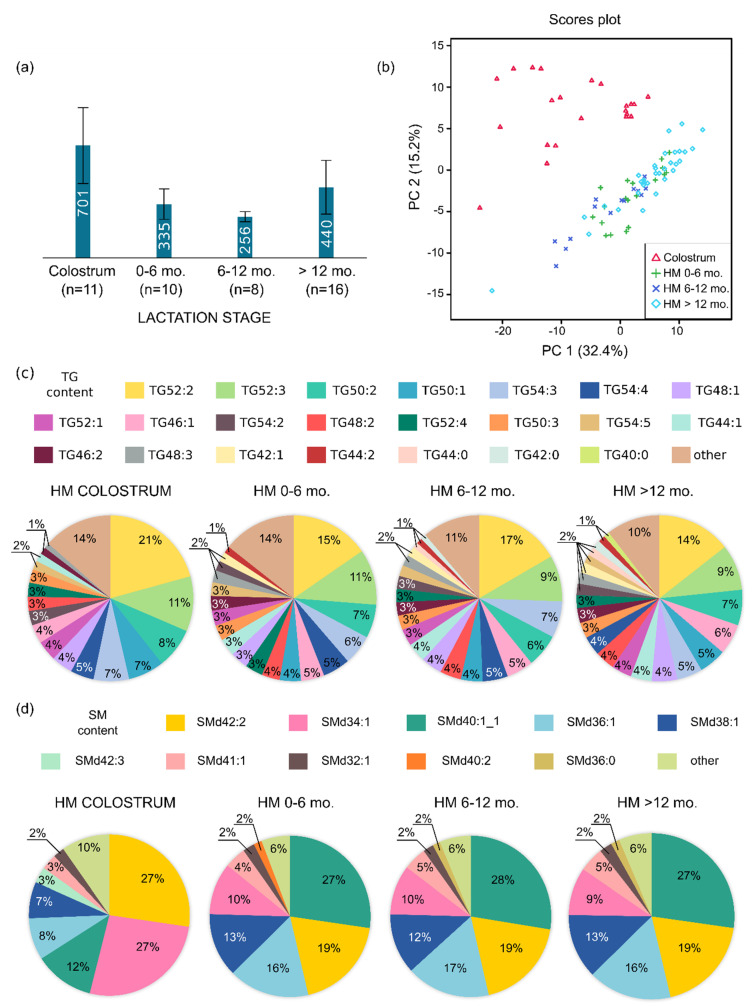
Figure 1.
(a) Average number of MFs detected in HM samples collected in different lactation stages. (b) PCA score plot of the lipid fingerprints of HM samples: colostrum (red triangles); HM 0–6 months (green plus sign); HM 6–12 months (dark blue cross); HM >12 months (light blue diamonds). (c) Average percentage relative amount of lipid species in HM samples within the TG class. (d) Average percentage relative amount of lipid species in HM samples within the SM class. MF, molecular feature; SM, sphingomyelin; TG, triacylglycerol.

