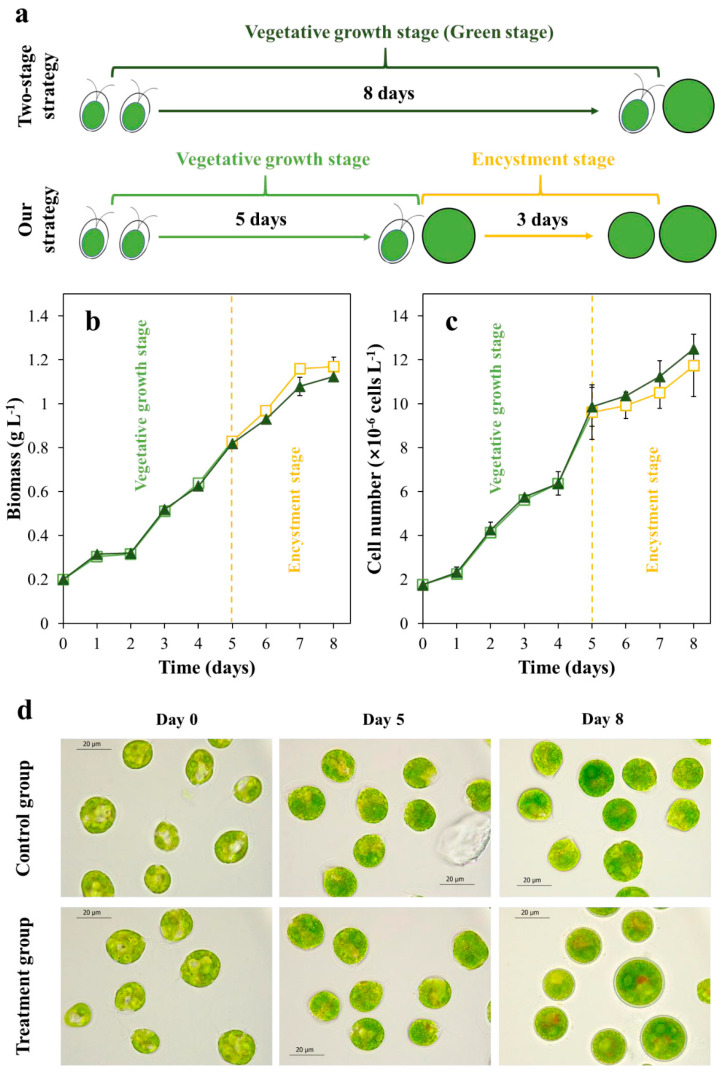
Figure 1.
The experimental design of the vegetative growth stage (a). The biomass (b), cell number (c), and cell morphological changes (d) of two groups in the vegetative growth stage (Dark green triangle: the data in the control group. Green square: the data of vegetative growth stage in the treatment group. Orange square: the data of encystment stage in the treatment group).

