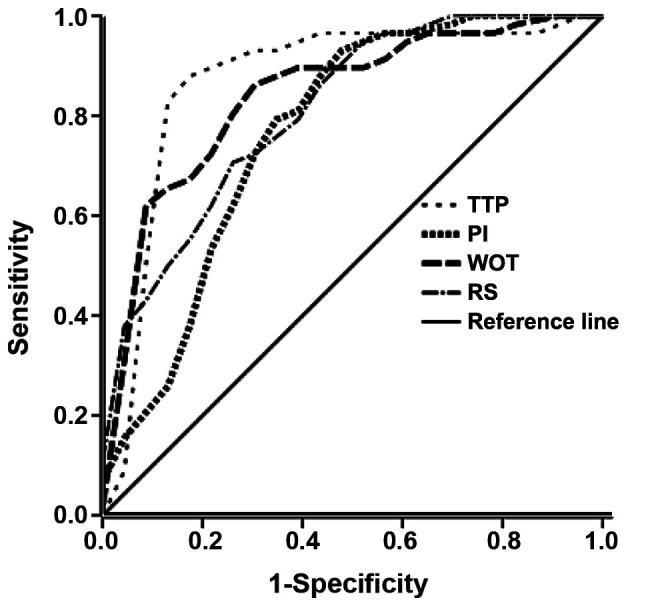
Figure 4.

Receiver operating characteristics analysis of the time-intensity curve parameters. PI, contrast agent perfusion starting time/intensity; TTP, time to peak intensity; WOT, wash-out time; RS, rising slope.

Receiver operating characteristics analysis of the time-intensity curve parameters. PI, contrast agent perfusion starting time/intensity; TTP, time to peak intensity; WOT, wash-out time; RS, rising slope.