
Figure 2. Characterization of a GIRK1-Specific Activator, GiGA1.
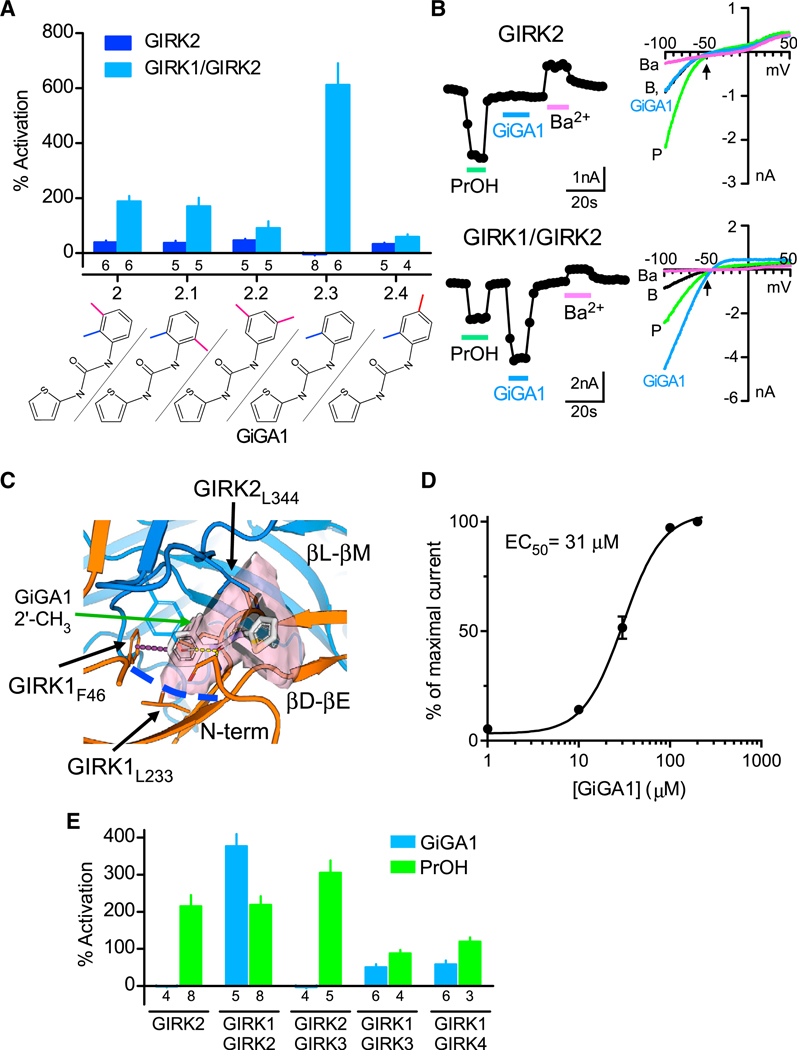
(A) Bar graph shows the mean percentage of activation responses for GIRK2 and GIRK1/GIRK2 channels to compound 2 and its analogs, varying the position or number of methyl groups on the phenyl ring (100 μM). The chemical structure for each compound is shown on the bottom. Currents are normalized to the Ba2+-sensitive basal current. Compound 2.3 showed specificity for GIRK1/GIRK2 (called GiGA1). n is indicated on the graph.
(B) Traces show the current response to PrOH (100 mM), GiGA1 (100 μM), and Ba2+ (1 mM) for GIRK2 (top trace) and GIRK1/GIRK2 channels (bottom trace). Current-voltage plots for GIRK2 channels (top) and GIRK1/GIRK2 channels (bottom) recorded in the absence (black) and presence of PrOH (green), GiGA1 (blue), and Ba2+ (magenta). The arrow indicates EK = −50 mV, with 20 mM Kout.
(C) Predicted binding mode of GiGA1 (white sticks) to a model of the GIRK1/GIRK2 (orange and blue cartoons, respectively) alcohol pocket from IFD. The binding pocket is depicted as a pink surface; the upper boundary of the pocket is limited by GIRK2L344, and the lower boundary is marked by GIRK1L233 (blue dashed line). o-methylphenyl moiety of GiGA1 is predicted to form π-π interactions with GIRK1F46 (purple dashed line). Note the position in the pocket of 2′ CH3 on the phenyl ring of GiGA1.
(D) Dose-response fit with the Hill equation is shown for activation of GIRK1/GIRK2 channels by GiGA1 (n = 6 cells). EC50 = 31 μM and Hill coefficient = 2.0.
(E) Bar graph shows the mean change in percentage of activation for subtypes of GIRK channels to 25 μM GiGA1 (blue) and 100 mM PrOH (green). Note the specificity for GIRK1/GIRK2 subunits. n is indicated on the graph.
Error bars represent SEM on the graphs.