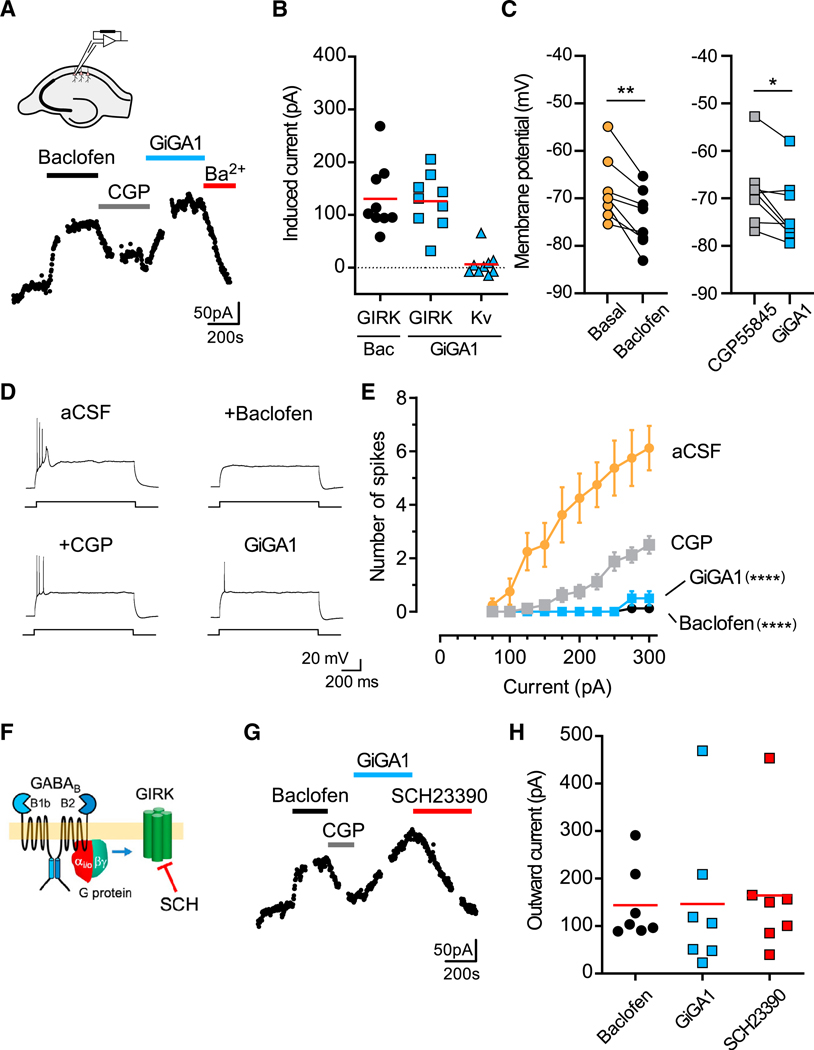
Figure 6. GiGA1 Induces GIRK Currents in Hippocampal CA1 Pyramidal Neurons.

(A) Whole-cell patch-clamp recording from a hippocampal CA1 pyramidal neuron shows baclofen-induced (300 μM) and GiGA1-induced (100 μM) outward currents and inhibition by CGP55845 (5 μM) and Ba2+ (1 mM), respectively. VH = −40 mV. Schematic shows the hippocampal slice and placement of the recording pipette.
(B) Scatterplot shows baclofen- and GiGA1-induced GIRK currents measured at −40 mV, as well as outward voltage-gated K (Kv) currents measured at 0 mV. n = 9 cells. The ed bar indicates the mean.
(C) Plot shows the individual RMP (I = 0) in the absence (basal) and presence of baclofen (left graph) and the presence of CGP55845 followed by GiGA1 (right graph). **p = 0.0028 baclofen versus basal, *p = 0.0182 GiGA1 versus CGP55845; paired t test. n = 8 cells.
(D) Voltage traces show induced action potentials (+275 pA) in the presence of aCSF alone or with baclofen, CGP55845, or GiGA1.
(E) Input-output plots show the firing frequency increases as a function of current injections for artificial cerebrospinal fluid (aCSF) (basal) or CGP55845 (5 μM) that are significantly suppressed by either baclofen (300 μM) or GiGA1 (100 μM), respectively. ****p < 0.0001 for basal versus baclofen and CGP55845 versus GiGA1 (n = 8); two-way repeated-measures ANOVA with Tukey’s multiple comparisons post hoc test for interaction between drug and current injection. Error bars represent SEM on the graph.
(F) Cartoon shows the inhibition of the GIRK channel by SCH23390 (Kuzhikandathil and Oxford, 2002; Montalbano et al., 2015).
(G) Whole-cell patch-clamp recording from the hippocampal CA1 pyramidal neuron shows baclofen-induced (300 μM) and GiGA1-induced (100 μM) outward currents and the response to CGP55845 (5 μM) and a GIRK-selective inhibitor (SCH23390; 30 μM), respectively.
(H) Scatterplot shows baclofen- and GiGA1-induced GIRK currents, as well as SCH23390-inhibited GIRK currents measured at −40 mV (n = 7 cells). The red bar indicates the mean (there is no significant difference).
