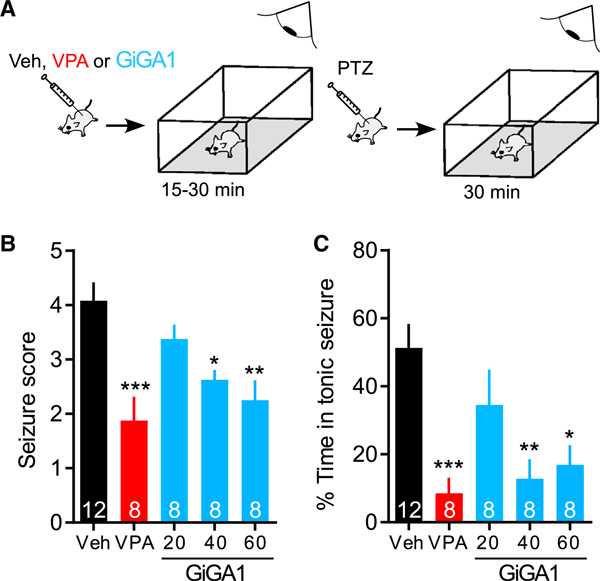
Figure 7. Anticonvulsive Effect of GiGA1 in the PTZ-Induced Epilepsy Model.

(A) Schematic shows the time course of the experiment. WT C57BL/6J mice first received an i.p. injection of Veh, valproic acid (VPA, 200 mg/kg), or GiGA1 (20, 40, and 60 mg/kg), and then locomotor activity was monitored for 15–30 min. Mice then received an i.p. injection of PTZ (60 mg/kg) to induce acute seizures and were monitored for another 30 min.
(B) Bar graph shows mean seizure scores based on the modified Racine score (Shimada and Yamagata, 2018). *p = 0.0278, **p = 0.0026, ***p = 0.0002 versus Veh; one-way ANOVA with Bonferroni’s multiple comparison test (F(4, 39) = 7.709; p = 0.0001).
(C) Bar graph shows the mean percentage of time with seizure scores ≥ 3. *p = 0.0101, **p = 0.0029, ***p = 0.0008 versus Veh; one-way ANOVA with Bonferroni’s multiple comparison test (F(4, 39) = 7.067; p = 0.0002).
n is indicated on the graphs. Error bars represent SEM on the graphs.
