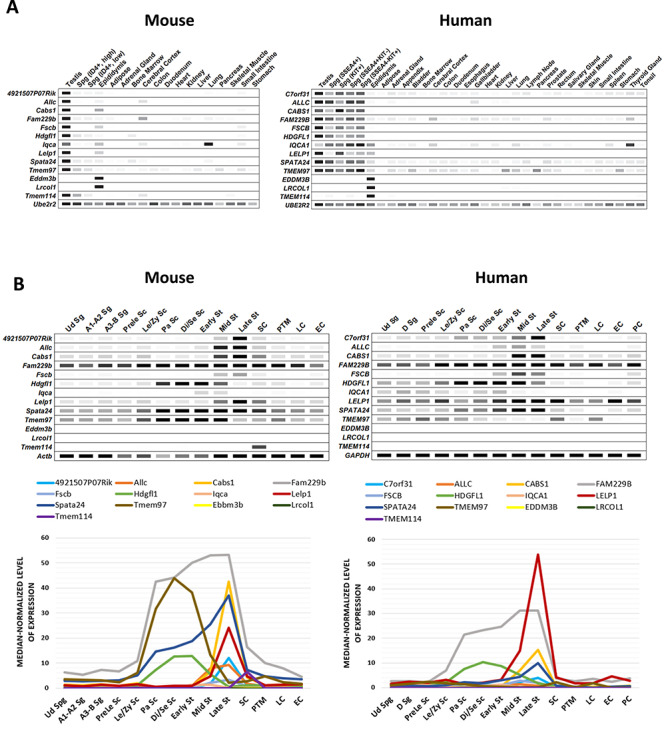
Figure 1.

In silico analyses of the expression patterns of specific genes in multiple tissues and spermatogenic cells. (A) Digital PCR indicates the expression patterns of several genes of interest in mouse and human tissues. The average transcript per million (TPM) value per tissue per gene was generated from 77 published mouse RNA-seq data sets and 147 human RNA-seq data sets, respectively. All 13 genes showed predominant or restricted expression in both mouse and human testes or epididymides. Black = maximum value TPM. (B) ScRNA-seq data depicting the median-normalized levels of mRNA expression of the 13 genes of interest during human and mouse spermatogenesis. Upper panel: The level of mRNA expression in each cell type is indicated by the band intensity. The threshold of median-normalized reads in mouse is set to nine, whereas the threshold in human is set to four. Lower panel: Linear graphs show the mRNA expression of each gene at various testicular germ and somatic cells. Ud Sg, undifferentiated spermatogonia; A1–A2 Sg, A1–A2 differentiating spermatogonia; A3–B Sg, A3–A4–In–B differentiating spermatogonia; D Sg, differentiated spermatogonia; Prele Sc, preleptotene spermatocytes; Le/Zy Sc, leptotene/zygotene spermatocytes; Pa Sc, pachytene spermatocytes; Di/Se Sc, diplotene/secondary spermatocytes; Early St, early round spermatids; Mid St, mid round spermatids; Late St, late round spermatids; SC, Sertoli cells; PTM, peritubular myoid cells; LC, Leydig cells; EC, endothelial cells; PC, perivascular cells.
