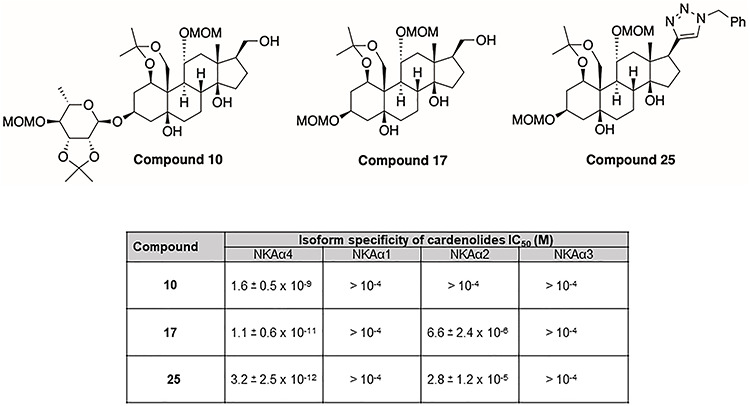
Figure 7.

Structure of analogs 10, 17, and 25 and their IC50 values for inhibition of NKA isoforms. The IC50 values were calculated from dose–response curves of inhibition of Na,K-ATPase α1β1, α2β1, α3β1, and α4β1 expressed in Sf-9 insect cells. Values are the mean ± SEM of three experiments [90].
