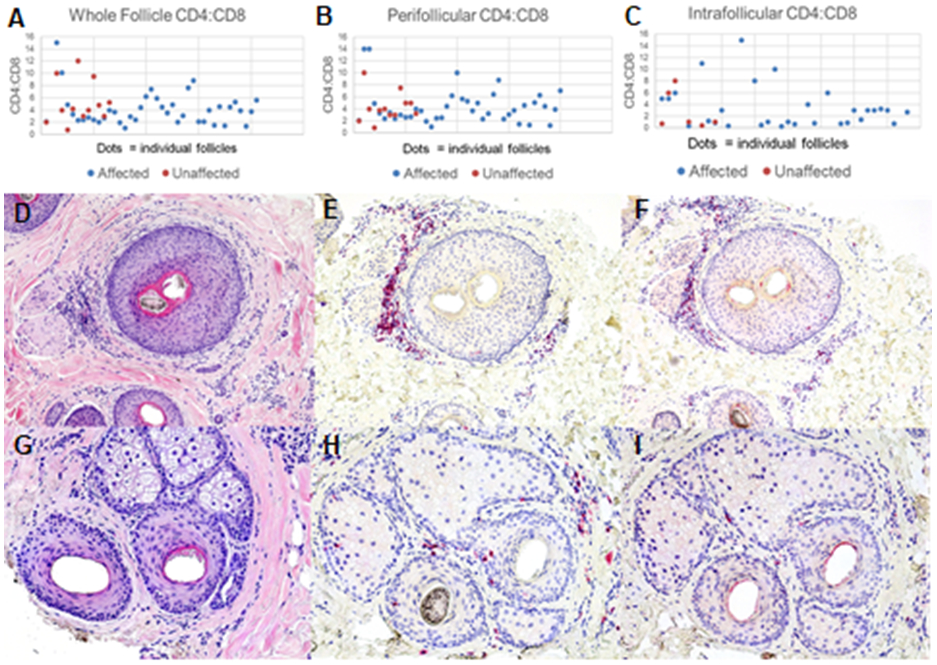
Figure 1. CD4:CD8 T-cell ratios in follicles of CCCA:

Both affected (blue dots) and unaffected (red dots) follicles showed an elevated CD4:CD8 T-cell ratio (A). The elevated CD4:CD8 ratio was seen in both the perifollicular (B) and intrafollicular (C) infiltrates of these follicles. A representative affected follicle is shown on H&E (D), as well as CD3 (E), and CD8 (F) immunostaining, also demonstrating a CD4 T-cell predominance. This is also seen in a representative unaffected follicle (G: H&E, H: CD3, I: CD8). Photomicrographs 100x, D and G-H&E, E, F, H and I-hematoxylin.
