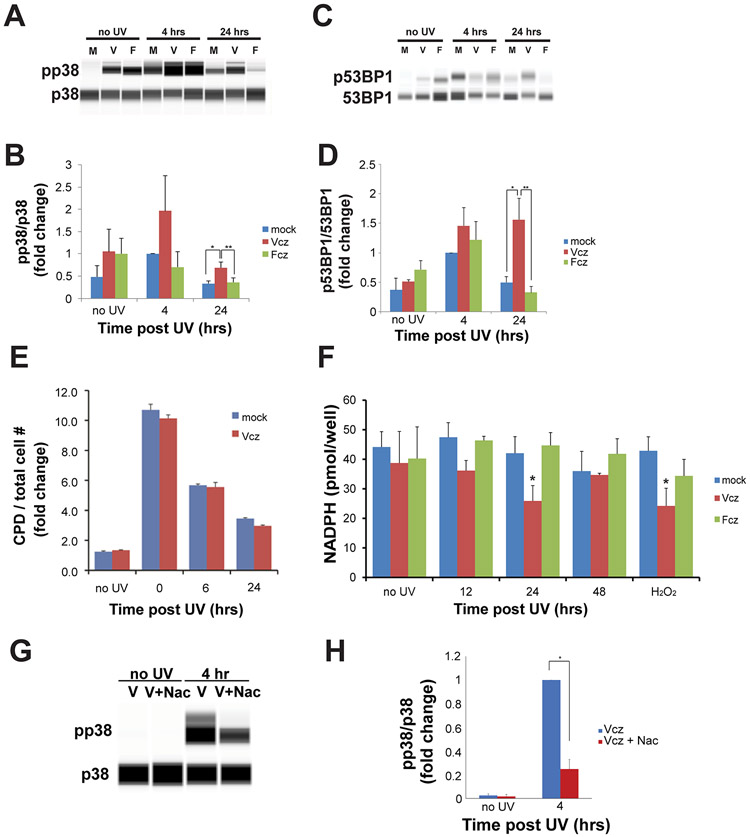
Figure 2. Voriconazole activates p38MAPK and p53BP1 in a UV-dependent manner but does not alter CPD formation. Voriconazole reduces cellular NADPH levels post-UV and activation of p38MAPK is inhibited by N-acetylcysteine.
PHKs were incubated with Vcz, Fcz, or vehicle for 24 hours; then, irradiated with UV as in Fig 1. Protein lysates were collected prior to UV, 4, or 24 hours after UV exposure. p38, pp38, 53BP1, and p53BP1 levels were determined by quantitative western blot analysis. A) Representative quantitative western blot for pp38 and p38. B) Graphical representation of pp38/p38 levels, normalized to mock at 4 hours. Error bars represent SEM. N = 3. Mock vs. Vcz at 24 hours, *p = .04; mock vs. Fcz at 24 hours, **p = .04. C) Representative quantitative western blot for p53BP1 and 53BP1. D) Graphical representative of p53BP1/53BP1 levels, normalized to mock at 4 hours. Error bars represent SEM. N = 5. Mock vs Vcz at 24 hours, * p = 0.009 and Vcz vs Fcz at 24 hours, ** p = 0.005. E) PHKs were fixed immediately after UV exposure (0 hour), and 6 or 24 hours after UV. CPD positive cells were quantified by performing quantitative in-cell western blotting; fluorescent signals were normalized to the total cell number. CPD levels under both conditions did not differ significantly. Error bars represent SEM. N=3. F) PHKs were harvested prior to UV irradiation or at the indicated time points and assayed for levels of NADPH. Hydrogen peroxide was the positive control. Assays were performed in triplicate for three independent experiments. Error bars represent SEM. Asterisks indicate p < 0.01 compared to mock at same time point. G) PHKs were treated with Vcz (25 μM) and a subset of PHKs were also treated with Nac (5 mM) one hour prior to UV irradiation with 25 mJ/cm2. PHKs were harvested prior to UV irradiation and at four hours post-UV. Protein lysates were subjected to quantitative western blotting for p38 and pp38. Representative western blot image for pp38/p38. H) Graphical representation of pp38/p38 levels. Error bars represent SEM. N = 3. Vcz vs Vcz + Nac at 4 hours, * p = 0.0004.

