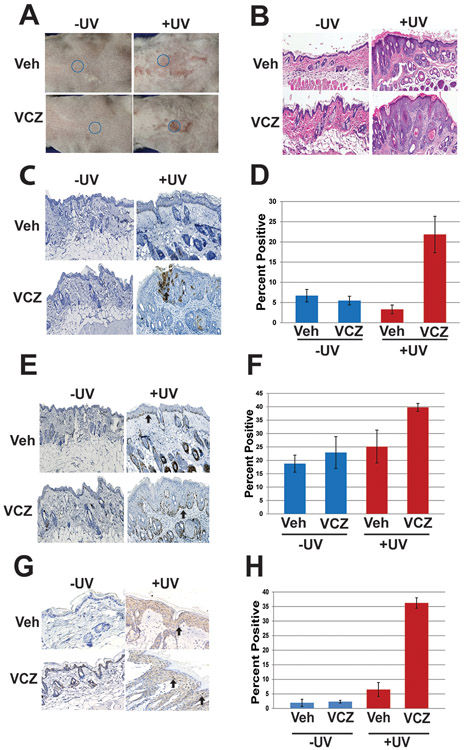
Figure 4. Voriconazole promotes UV-induced dysplasia in vivo.
K14-Fyn Y528F female transgenic mice were assigned to four cohorts and treated topically with vehicle, Vcz (25 μM), vehicle + UV and Vcz + UV as described, N=3 mice per cohort. Representative photographs and biopsies were taken from mice at indicated times and subjected to histology and immunohistochemistry to detect Ki-67, activated Src kinases and activated 53BP1. Representative biopsies from 8 week time point. A) Representative back skin photographs of mice; blue circle indicates biopsy site at 8 weeks selected for thickest area by palpation. B) Representative photomicrographs of skin histology showing increased hyperplasia and dysplasia in the Vcz + UV cohort. C and D) Representative photomicrographs and graphical data of immunohistochemistry for activated Src-family tyrosine kinases. Highest staining levels were detected in the Vcz + UV samples. Black arrow indicates representative positive staining. Error bars show SEM. Veh + UV vs. Vcz + UV, p = 0.02. E and F) Representative photomicrographs and graphical data of immunohistochemistry for Ki-67. The Vcz + UV cohort demonstrated the highest positive staining index. Black arrow indicates representative positive nuclear staining. Error bars show SEM. Veh + UV vs. Vcz + UV, p = 0.0005. G and H) Representative photomicrographs and graphical data of immunohistochemistry for phosphorylated 53BP1. Black arrows indicate representative positive granular staining in the nucleus. The Vcz + UV cohort demonstrated the highest levels of positive staining. Error bars show SEM. Veh vs. Vcz + UV, p = 7.9 × 10⁻⁶, Veh +UV vs Vcz + UV. p = 6.8 × 10⁻⁵.

