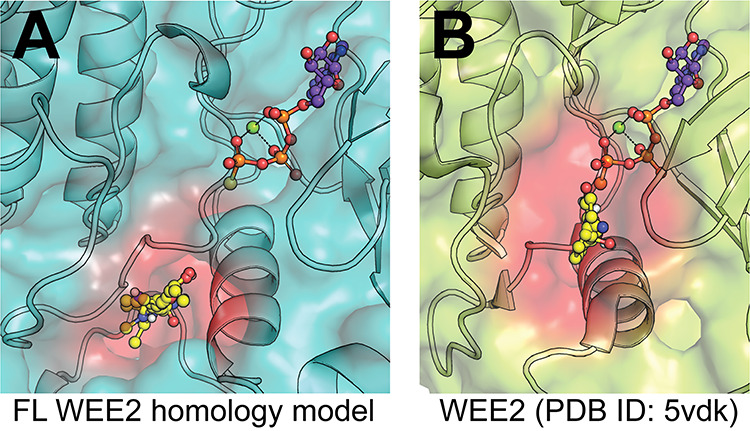
Figure 2.

Modeling of potential allosteric site. (A) Full-length WEE2 homology model. FTMap was used on a Phyre2 homology model to identify a region (red) where multiple solvent species (yellow) found energy minima, indicating a potential binding pocket. Orthosteric ATP site is approximated by alignment and extraction of ATPgammaS (non-hydrolyzable ATP analog, purple) from enzyme structure in the same family (EC 2.7.10.2; PDB ID: 5c03). (B) WEE2 kinase domain crystal structure. FTMap was again used to locate potential binding sites in the crystal structure (PDB ID: 5vdk) outside of the orthosteric site, represented by the same ATPgammaS molecule extracted from PDB ID: 5c03 for consistency in orientation. This analysis revealed a similar site (red), which was also identified by FTSite and SiteMap, that engaged with several non-ATP associated side chains.
