Figure.

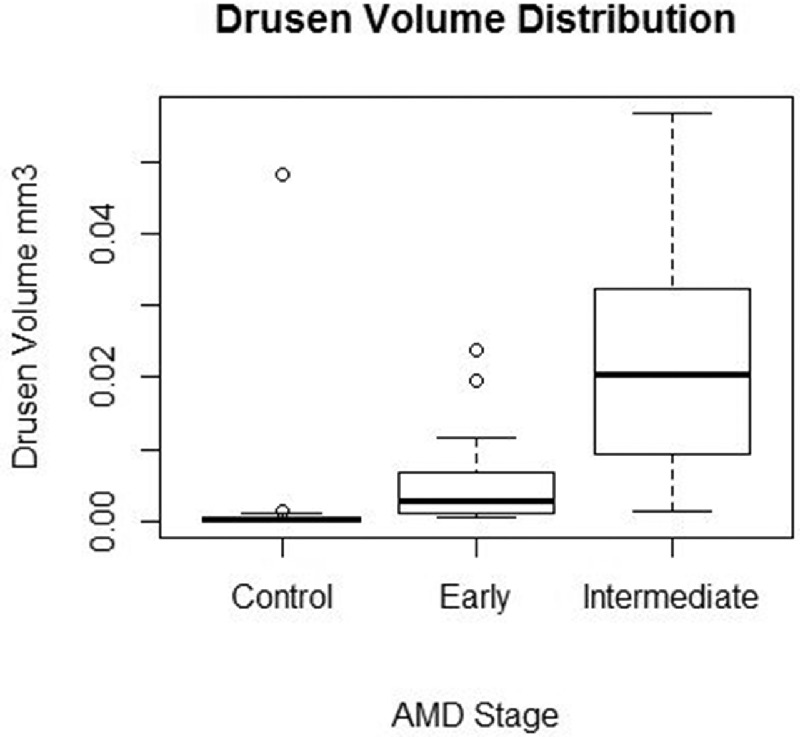
Boxplot showing drusen volume (in mm3) for controls and early and intermediate AMD (excluding outliers). Each boxplot includes the maximum (upper whisker), upper quartile (top of the box), median (horizontal line in box), lower quartile (bottom of the box), and minimum (lower whisker) values.
