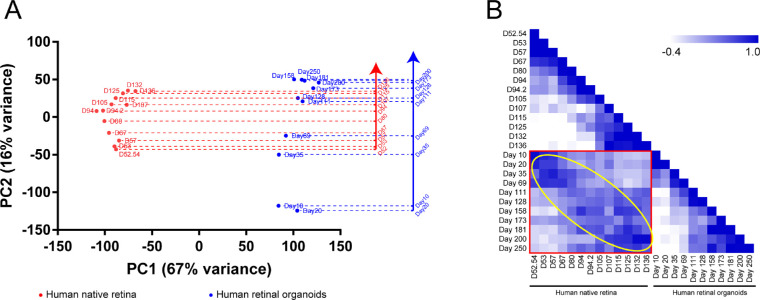
Figure 4.
The sample features of human native retina and retinal organoids. (A) PCA plot shows a comparison of the transcriptome data between human native retina and retinal organoids. PC2 on the y axis corresponds with the developmental time. The mapping of sample points in the y axis represents their relative position during development. (B) Pearson's correlation coefficient is performed to show the correlation between the two groups of samples. The yellow circle indicates that the two groups of samples are consistent over time.

