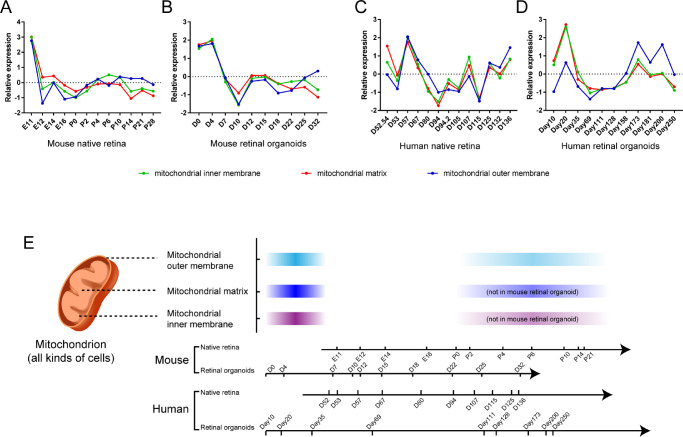
Figure 8.
Retinal mitochondria related gene expression in native retina and retinal organoids. The relative expression curves of mitochondria-related genes in mouse native retina (A), mouse retinal organoids (B), human native retina, (C) and human retinal organoids (D) over time were shown. (E) The developmental timeline of retinal mitochondria in mouse and human. Color depth represents the gene relative average expression.

