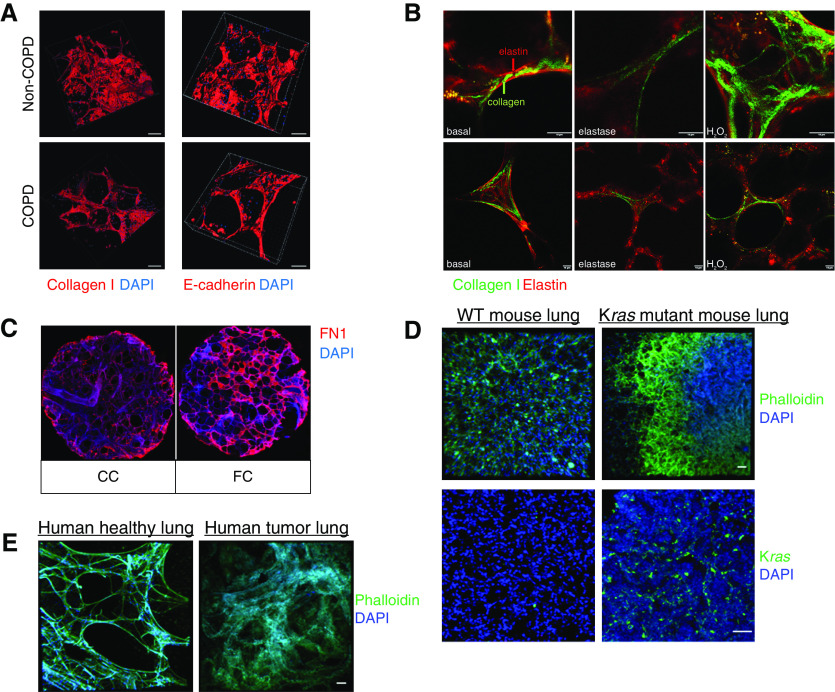
Figure 3.
PCLS disease modeling of COPD, IPF, and lung cancer. (A) Three-dimensional reconstruction of collagen I and E-cadherin staining on PCLS generated from healthy and COPD human explants (15). Scale bars: 100 μm. (B) Collagen I and elastin fibers in an ex vivo elastase COPD disease model in mouse PCLS (38). Scale bars: 10 μm. (C) Extracellular matrix deposition of fibronectin in PCLS treated with a fibrotic cocktail (FC) to model early fibrosis-like changes (48). Scale bar: 1 mm. (D) PCLS immunostained against phalloidin and Kras. PCLS were obtained from the mouse KRAS model (58). Scale bars: 50 μm. (E) Structural differences between tumor and tumor-free regions of PCLS generated from human explants. Scale bars: 50 μm. Reprinted by permission from References 15, 38, 48, and 58. CC = control cocktail; FN1 = fibronectin; WT = wild-type.

