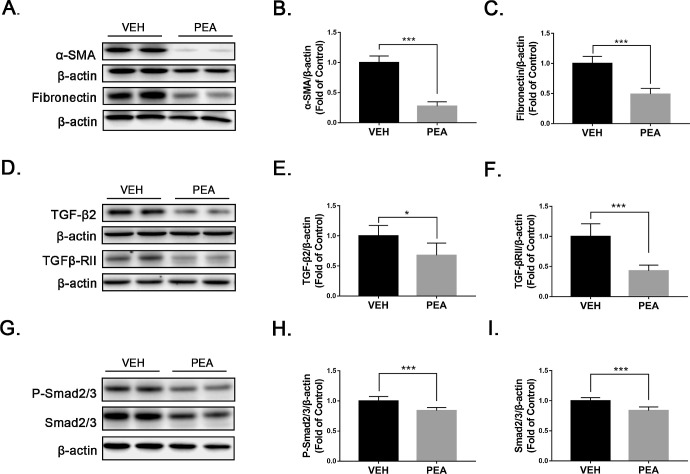
Figure 3.
Antifibrotic effects of PEA in OIR retinas. (A–C) Protein levels of (A, B) α-SMA and (A, C) fibronectin were measured by western blot analysis and quantified by densitometry in VEH- and PEA-treated OIR retinas (n = 6). (D–I) Similarly, protein levels of (D, E) TGF-β2, (D, F) TGFβ-RII, (G, H) P-Smad2/3, and (G, I) Smad2/3 were measured by western blot analysis and quantified by densitometry (n = 6). Data are presented as mean ± SEM; *P < 0.05, ***P < 0.001.

