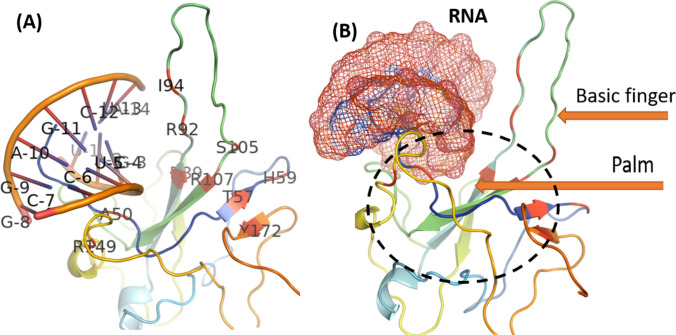
Fig. 1.
Residues interactions between N proteins and Nsp3. (a) surface representation of N proteins and Nsp3 (PDB ID: 6w6y, residues 207–379). Yellow represents N protein residues involved in interactions. (b) The number of clusters predicted by HADDOCK server and their van der Waals and electrostatic energies. Ribbon representation of loop residues of N. The N-NTD is involved with viral RNA binding during replication

