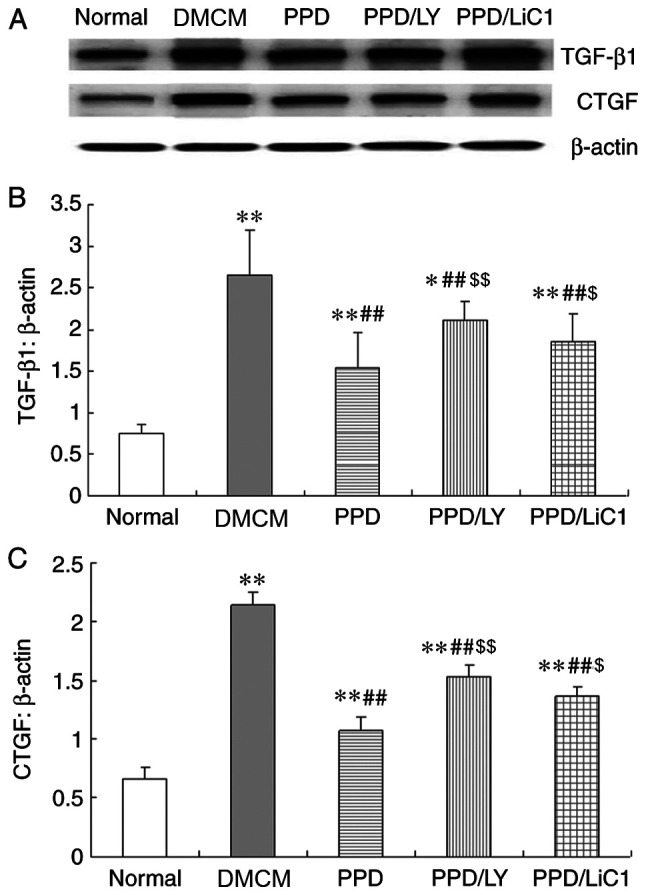
Figure 3.

PPD reduced (A and B) TGF-β1 and (A and C) CTGF (expression levels in the heart tissues of diabetic rats. The values are presented as the mean ± SD. *P<0.05, **P<0.01 vs. the Normal group; ##P<0.01 vs. the DMCM group; $P<0.05 and $$P<0.01 vs. the PPD group. PPD, 25-OH-PPD; TGF-β1, transforming growth factor beta 1; CTGF, connective tissue growth factor; DMCM, diabetic cardiomyopathy.
