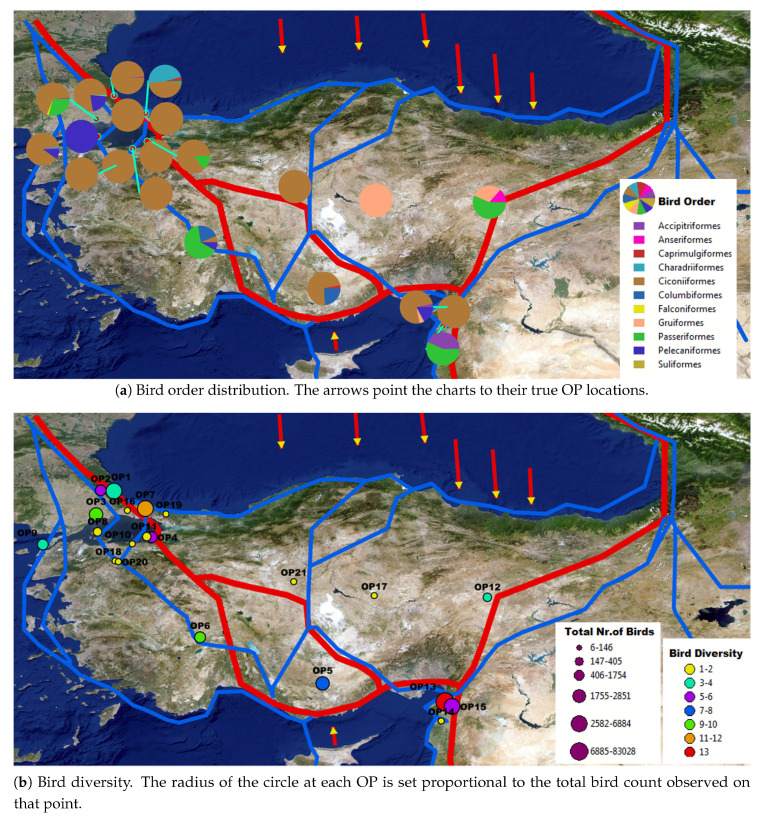
Figure 13.
Bird order distribution and diversity level map of Turkey with overlays of geographic information system (GIS) bird migration routes data layer extracted by Turan et al. [79] (best viewed in zoom and color). The red lines represent the primary migration routes where the magnitude of the bird migration is higher, the blue lines represent the secondary migration routes where the magnitude of the bird migration is relatively high and lower than the primary routes, and arrows represent the broad front across routes of migrant birds where the bird movement occurs on north–south axis rather than following the particular routes. ArcGIS software was used for visualization.

