
Figure.
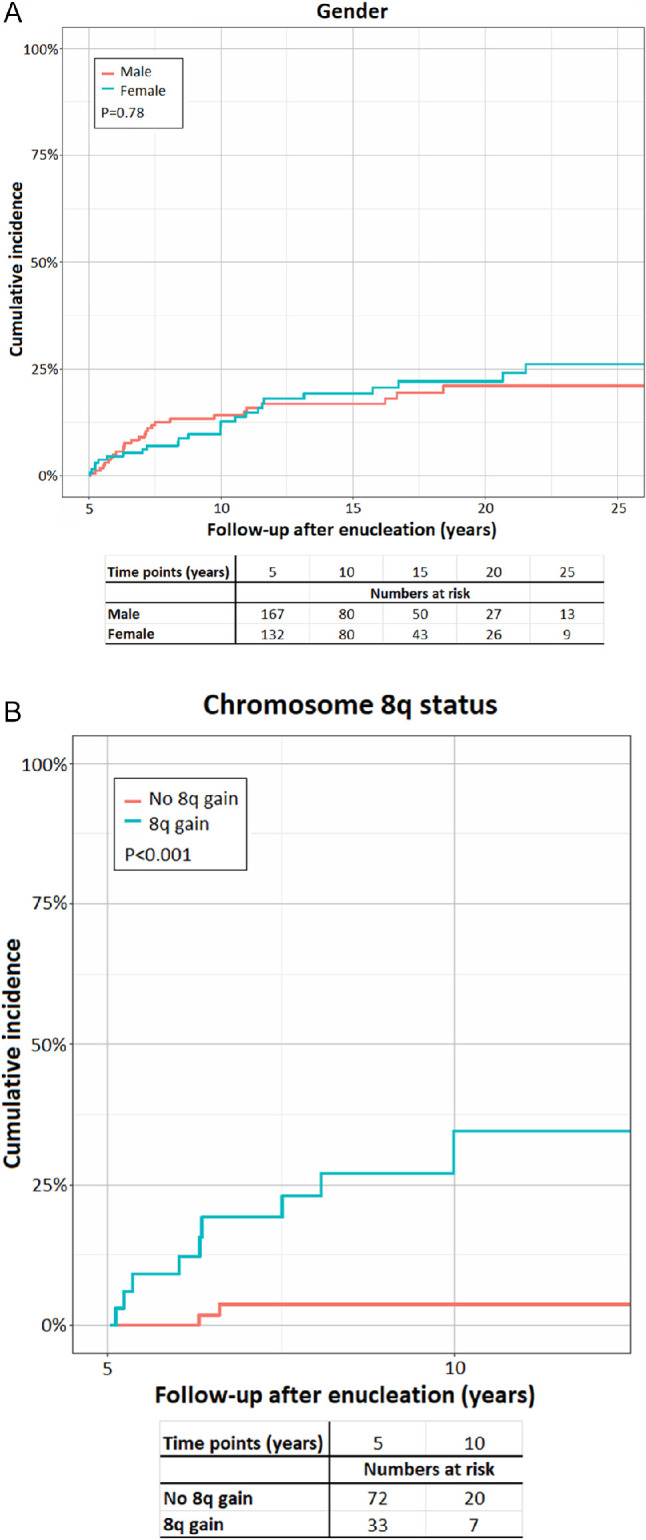
Cumulative incidence curves depicting the effect of gender (A) and chromosome 8q status (B) on the incidence of UM-related death 5 years after enucleation.
Official websites use .gov
A
.gov website belongs to an official
government organization in the United States.
Secure .gov websites use HTTPS
A lock (
) or https:// means you've safely
connected to the .gov website. Share sensitive
information only on official, secure websites.
Cumulative incidence curves depicting the effect of gender (A) and chromosome 8q status (B) on the incidence of UM-related death 5 years after enucleation.