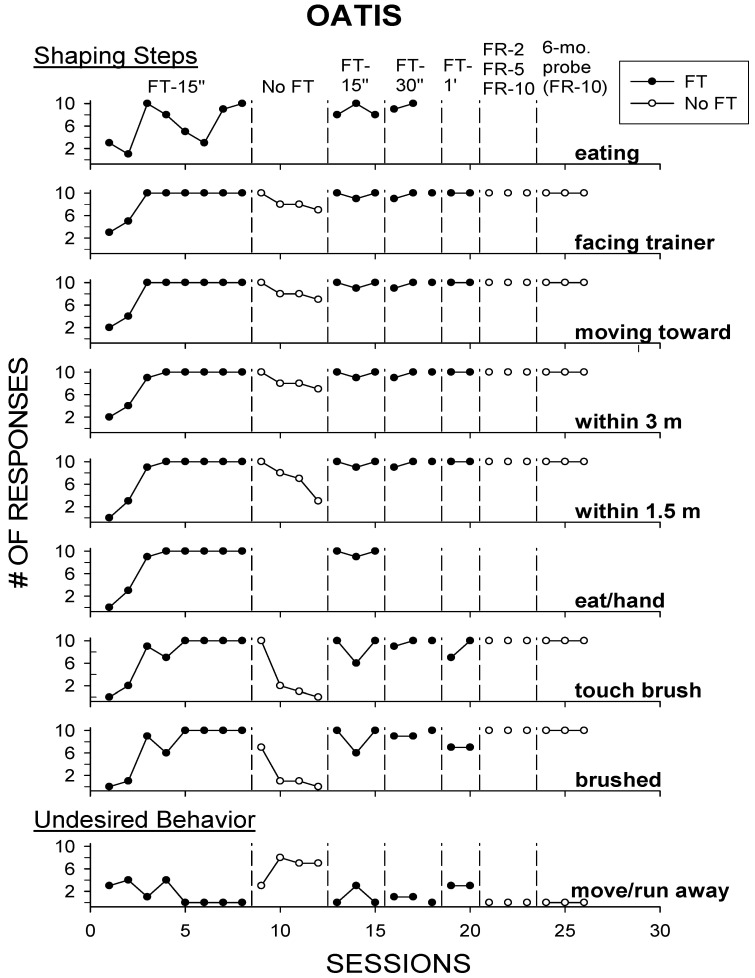
Figure 1.
The number of responses for each step in the shaping procedure (top 8 graphs) and the undesired response (moving away; bottom graph) in Experiment 1. Closed circles represent when a Fixed-Time (FT) food schedule was in effect, while open circles represent when no Fixed-Time (No FT) food schedule was in effect. Fixed-Time (FT) schedules of differing times and Fixed-Ratio (FR) schedules of differing responses are listed at the top of the graph. The y-axis shows the number of responses that occurred per session (out of 10 trials), and sessions are listed on the x-axis.

