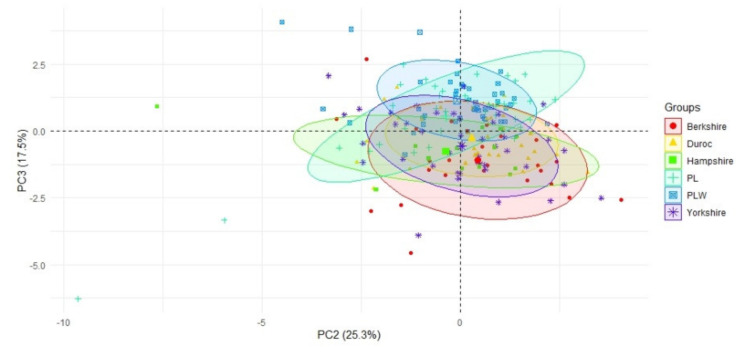
Figure 3.
A scatterplot of the second PC against the third PC, with the indication of the breeds. The second PC was correlated with the farrowing and farrowing-to-conception intervals (negative correlation), while the third PC was correlated with the total number of born piglets per litter (positive correlation). Axes represent loadings onto components 2 and 3.

