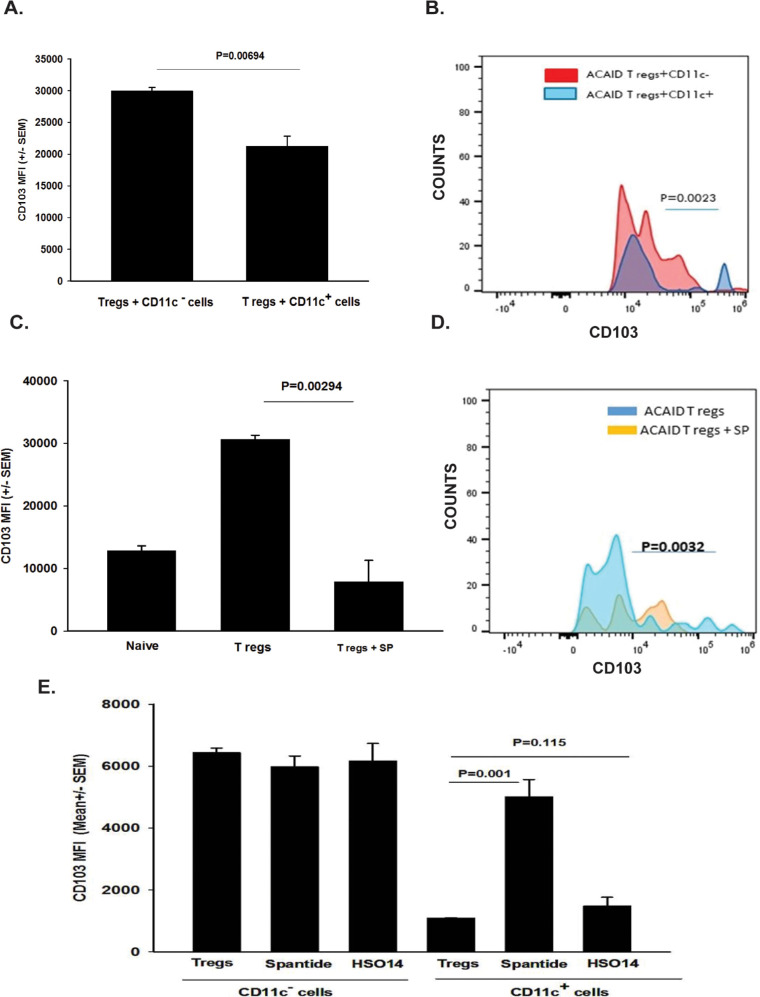
Figure 4.
Trephine-induced CS cells or SP alone downregulates CD103 on ACAID Tregs. CD8+ ACAID Tregs were induced by AC injection of OVA. Four days later, CD8+ ACAID Tregs were isolated from the spleens and were cocultured for 20 hours with (A, B) CD11c+ and CD11c− CS cells or (C, D) with SP alone (0.1 pg/mL). (E) CD11c+ CS cells or CD11c+ CS cells in the presence of either Spantide II (36 ug/mL) or HSO14 (36 ug/mL). CD103 expression on CD8+ T cells was evaluated by flow cytometry 24 hours later. (A,C, E) Y-axis label represents mean fluorescence intensity (MFI), which is a reflection of the density of CD103 expression. (B, D) Y-axis label represents “counts” or % of cells that were CD103+. There were five animals per group. Each experiment was performed twice with similar results. Results are expressed as mean ± SEM. P values were determined based on either MFI (A, C, E) or number of CD103+ cells (B, D).

