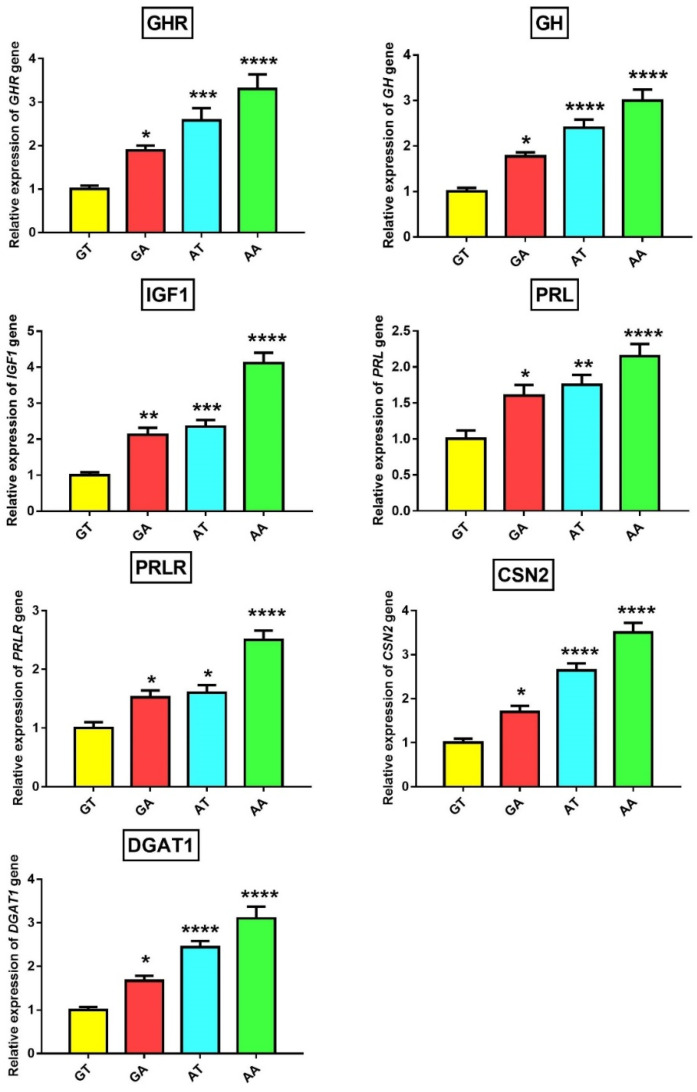
Figure 2.
Associations between GT, GA, GT, and AT haplotypes and expression of GHR, GH, IGF1, PRL, PRLR, CSN2, and DGAT1 genes in milk somatic cells as detected by qRT-PCR. The β-actin gene was used as an internal control and data are presented as mean of gene expression fold change ± SEM (n = 9/haplotype) with wild haplotype GT considered as the baseline. * p < 0.05, ** p < 0.01, *** p < 0.001, and **** p < 0.0001. All p-values were obtained using Bonferroni’s correction for comparison of all haplotypes against wild haplotype GT.

