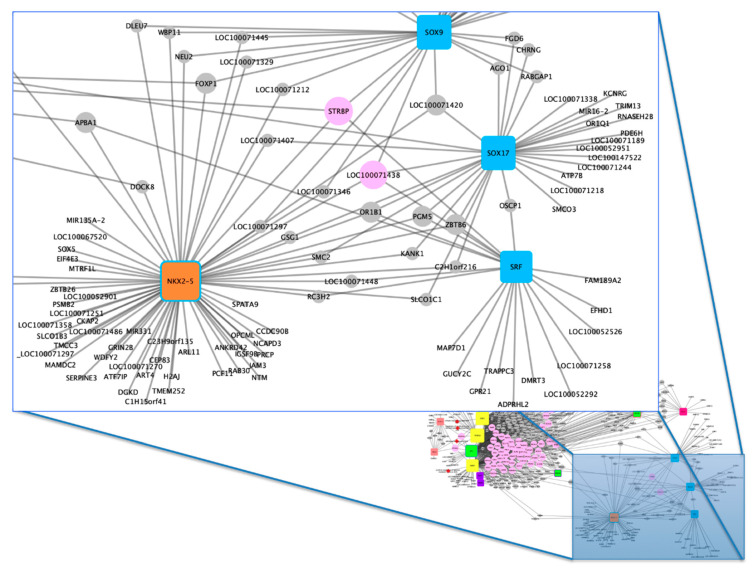
Figure 3.
Horse performance gene–transcription factor (TF) network, focus 2. Rounded square nodes represent the TFs, wherein four main TFs are highlighted: NKX2-5, SRF, SOX17 and SOX9. Blue nodes are associated with genes from group 5, whereas the one with two colors (orange and blue border) is associated with groups 7 and 5, respectively. Gray nodes are the identified candidate genes, whereas the main candidate genes related with horse performance are represented by light pink color.

