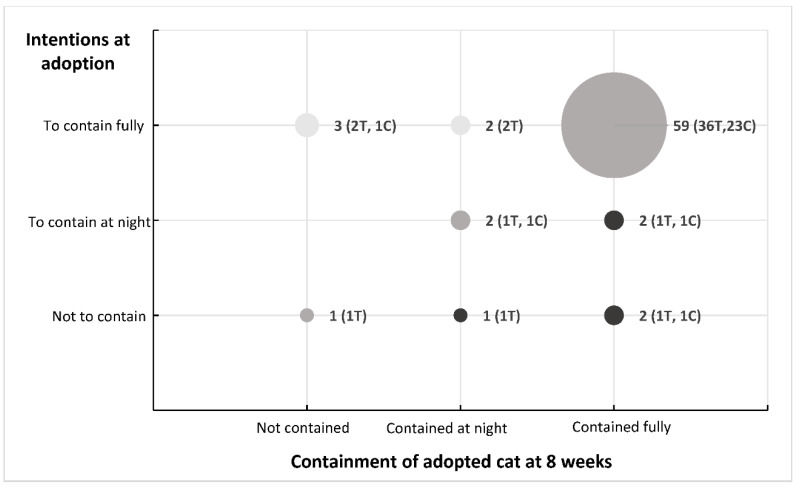
Figure 1.
Summary of the containment intentions of the 72 participants at the time of adoption (vertical axis), and their containment behaviour after 8 weeks (horizontal axis). Size of dots represent number of participants. The lighter dots represent participants who did not follow through on their intentions, the darker dots represent those participants who surpassed their initial intentions. T = treatment, C = control.

