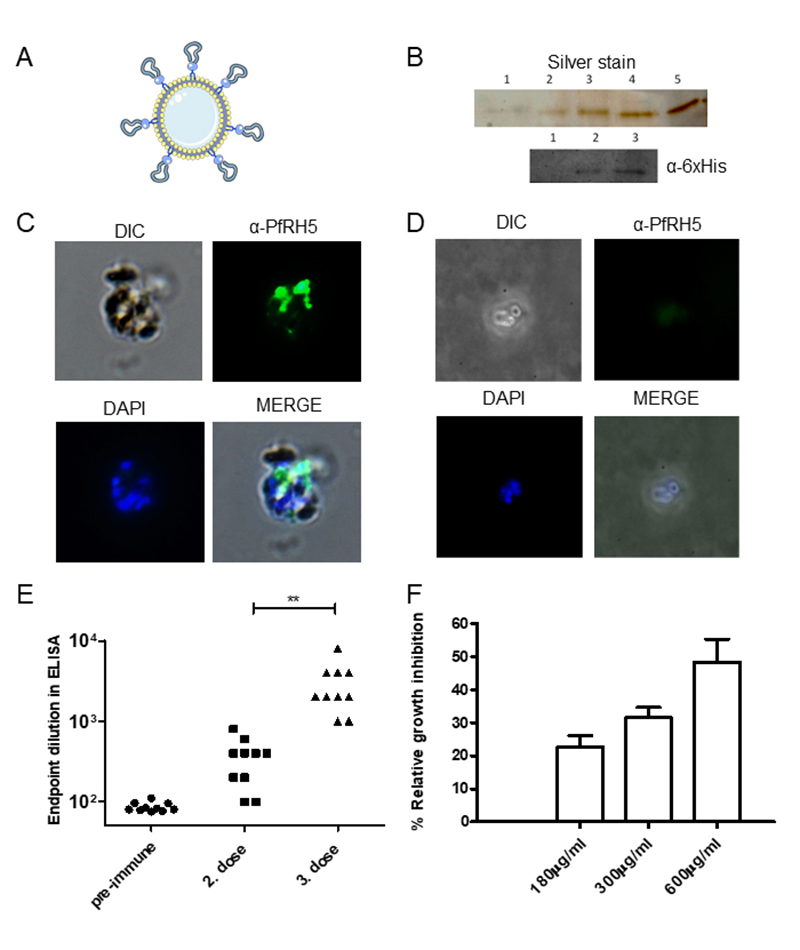
Figure 3. Formation and characterization of proteoliposomes with PfRH5-CD14-GPIrec for vaccine use against P. falciparum. (A) Proposed model of PfRH5-CD14-GPIrec-loaded liposomes. (B) Proteoliposomes loaded with the antigen PfRH5-CD14-GPIrec were produced and submitted to SDS-PAGE and proteins were visualized by silver stain (upper gel). In Lane 1, the supernatant of the proteoliposome production was applied. Lane 2 is a sample of PfRH5-CD14-GPIrec used in proteoliposome production. Lanes 3, 4 and 5 represent aliquots of three different proteoliposomes used in immunizations. In the lower gel, an antibody against the 6xHis tail was employed to detect the recombinant form of PfRH5-GPI in proteoliposomes (Western blot). Lane 1 shows empty liposomes, Lane 2 the recombinant form of PfRH5-CD14-GPI used to produce proteolipossomes, and Lane 3 material from proteoliposomes utilized to immunize mice. Visualized or detected bands show the expected molecular weight around 50 kDa. (C) P. falciparum schizonts were analyzed by immunofluorescence to verify whether IgG in the sera from immunized mice recognized the native form of PfRH5 in rhoptry structures from fresh parasites. (D) The same immunofluorescence approach was applied to pre-immune sera to reveal the absence of unspecific recognition. (E) Sera from animals (n = 10) were used in ELISA assays against late schizont extracts of P. falciparum and the pre-immune sera were used as to establish a cutoff for reactivity in ELISA after the second and the third dose of immunization. A third dose increased antibody responses in immunized mice (paired t test, ** is p < 0.01). (F) Sera from immunized mice were used in in vitro assays to verify whether the antibodies generated after immunization were able to inhibit reinvasion of P. falciparum. Different quantities of individually purified IgG showed a dose-dependent inhibitory effect at 180 µg/mL, 300 µg/mL and 600 µg/mL IgG, with matched quantities of pre-immune IgG. Shown are the average values from 10 individual IgG preparations.

