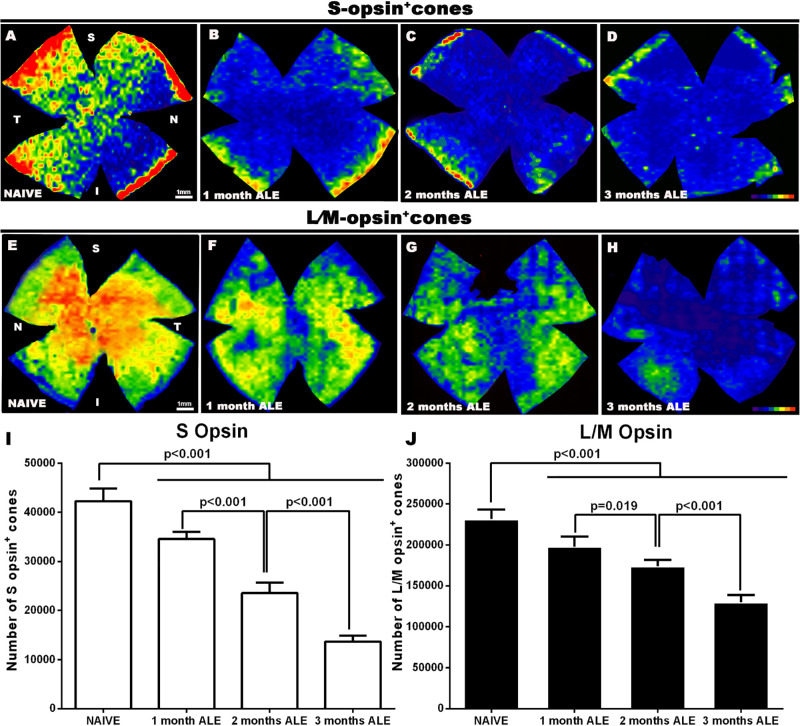
Figure 1.
Survival of S and L/M- opsin+ cones. Representative isodensity maps of (A–D) S- and (E–H) L/M- opsin+ cones in (A, E) naïve animals and in experimental animals at (B, F) 1, (C, G) 2, and (D ,H) 3 months ALE. Progressive death of both cone populations can be observed in experimental animals throughout the retina. Color scale of S-opsin+ cones/mm2: 0 (purple) to ≥1300 (red). Color scale of L/M-opsin+ cones/mm2: 0 (purple) to ≥6500 (red). (I, J) Graphs showing the mean number of (I; white bars) S-opsin+ cones and (J; black bars) L/M-opsin+ cones in naïve and experimental animals at increasing times ALE. Light exposure causes a significant progressive death of both cone populations (One-way ANOVA, Tukey test).

