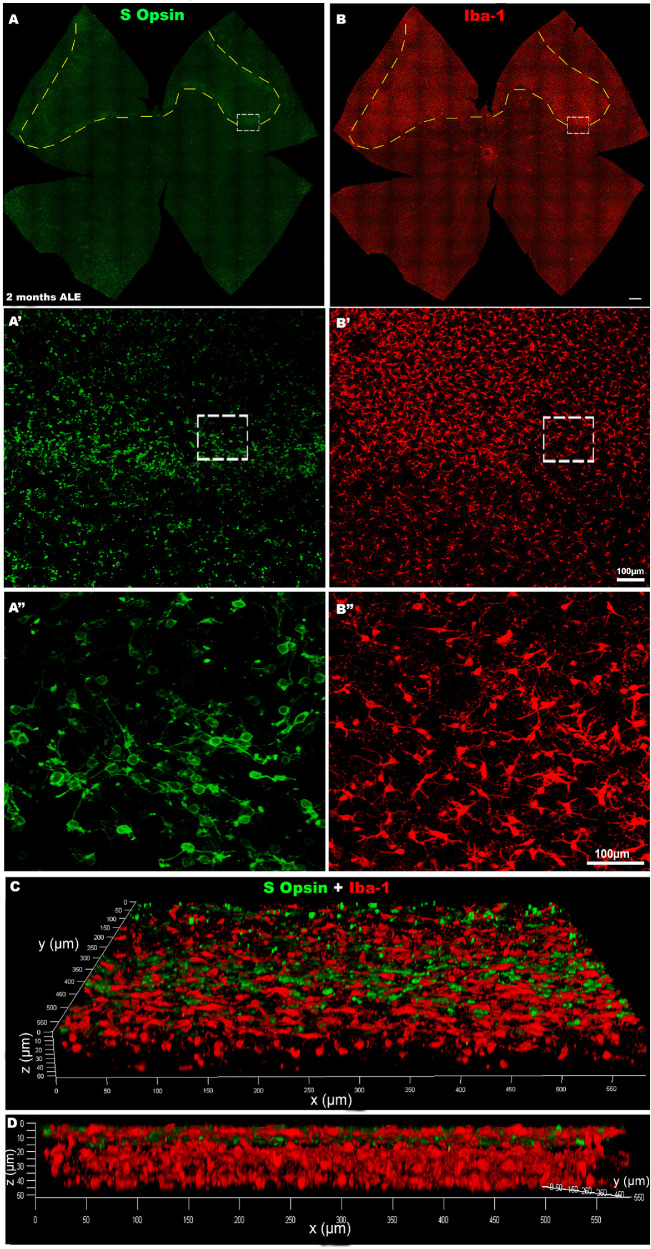
Figure 8.
S-cone loss and microglial cell reactivity 2 months ALE. Photomontages of the same representative retinal whole mounts of an animal processed 2 months ALE and immunoreacted for S-cones (A, green) and for Iba-1 (B, red) showing an area of the superior retina (dashed line) devoid of S-cones (A) and filled by activated microglial cells (B). Magnifications (A′-B″) of the border of the cone death area. The insets in A′ and B′ are shown at higher power in A″ and B″, to show that at the limit the S-cone morphological changes and the microglial cell activation are more marked. Three-dimensional confocal reconstruction of the same area shown in A″ and B″ to document the location within the retina of the activated microglial cells (0 µm in the z axis corresponds to the photoreceptor outer segment layer).

